The economy consists of several components, including both institutional and individual people. Studying the progress of those components individually and collectively helps the governments, economy, and society to make future policies. The study of sectoral and sub-sectoral progress is an important exercise for the government to plan for its resource allocation and the economy to identify the growth potentials to be harnessed by the people and the private sector.
After the Independence, the Union Government introduced the Annual Economic Survey Report along with Budget announcements in the year 1950-51. Given the importance of the economic survey analysis and perspectives on global and domestic policies on sectoral areas, the then Union Government separated the Union Budget and Economic Survey Report in 1964, which is being followed.
Since the major economic reforms of 1991, the States embarked on building their growth and development path by bringing out a detailed analysis of sectoral, regional, intra-state district-wise, and block-wise progress of development. Like the Union Economic Survey, many State Governments have also started publishing their own economic survey to present a review of the major developments of the economy and make policy suggestions for the future.
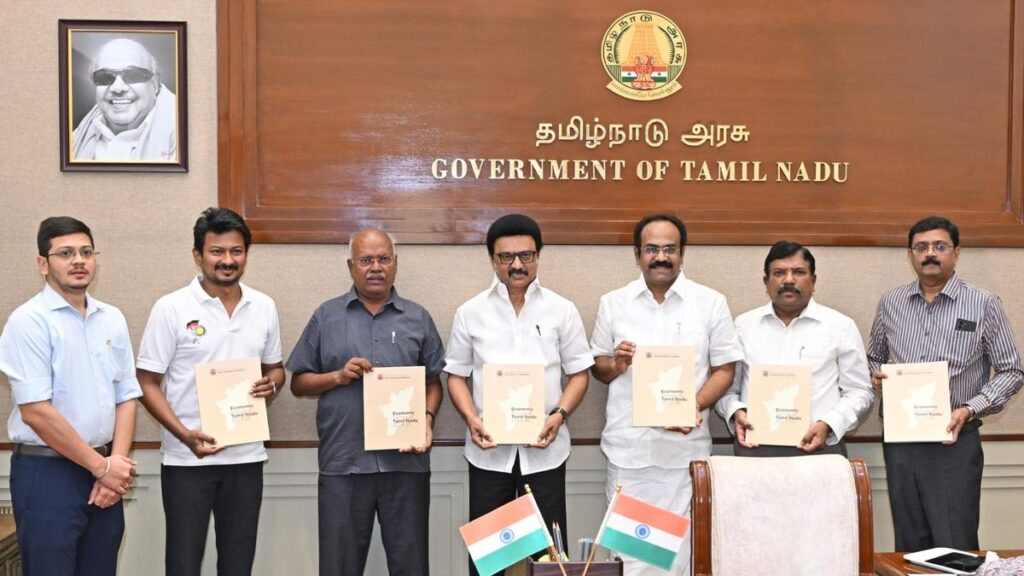
For many years, all the Southern States have been publishing their annual economic surveys while presenting the budgets. The State of Tamil Nadu, the sole exception for years, has joined the bandwagon by publishing its “First State Economic Survey 2024-25” on 13th March, 2025, a day before the Budget Announcement for the financial year 2025-26 on 14th March, 2025. The survey was prepared by the Tamil Nadu State Planning Commission, led by a team of experts. The Government of Tamil Nadu used to bring out the “Economic Appraisal” report published by the Department of Evaluation and Applied Research (DEAR), with time lags. These reports were a kind of review of progress with little attention for public policy perspectives.
This analysis focuses on key highlights of the Tamil Nadu’s First Economic Survey 2024-25 in terms of its presentation, and analysis of key issues.
The state has set an ambitious goal of achieving a $1 trillion economy by 2030. As a highly industrialized and urbanized economy with strong linkages of global value chains on key sectors, Tamil Nadu’s economy has demonstrated remarkable economic resilience, consistently achieving growth rates of 8% or more since 2021-22. The state is estimated to grow above 8% in 2024-25.
Further, the State achieved an average growth rate of 6.37% as compared to the national average of 6.1% during the period from 2012-13 to 2023-24. In the last two years from 2022-23 to 2023-24, this growth trajectory accelerated and the state achieved an average growth rate of 8.18%. The state did not estimate the likely growth rate for the financial year 2025-26 stating the economic situation is “unstable”.
In terms of Per Capita Income at current prices, Tamil Nadu has Rs.2.78 lakhs which is 1.6 times more than the national average of Rs.1.69 lakhs in 2022-23 and is 4th largest state in per capita income ranks. While, in real terms, Tamil Nadu ranked 7th among major states in 2022-23, with a per capita income of Rs.1.66 lakh. However, there are huge variations among the districts within the state of Tamil Nadu.
The district-wise per capita income highlights major variations among districts in Tamil Nadu. Chengalpattu district has the highest per capita income at Rs 6.48 lakh in 2022-23, followed by Kancheepuram (Rs.6.47 lakh) and Chennai (Rs 5.19 lakh). Notably, in 8 out of the state’s 38 districts, the per capita income exceeds the state average of Rs.2.78 lakh. These top-performing districts surpass the per capita income levels of several major Indian states, including Telangana, Haryana, and Karnataka. At the same time, the districts of Villupuram and Tiruvarur has per capita income of Rs.1.48 lakh each which is lowest in the state. Also, 7 districts (Ramanathapuram, Thiruvarur, Myiladuthurai, Ariyalur, Perambalur, Kallakurichi and Villupuram) have per capita incomes below the national average.
Rapid urbanization drives demand for infrastructure services such as transportation, housing, sanitation, and utilities but in each of these areas, Tamil Nadu lags and is unable to provide good quality of facilities and services.
Let’s look at the sectoral growth of Tamil Nadu’s Economy as emphasized in the Economic Survey:
- Tamil Nadu’s agriculture heavily depends on monsoons. The sector contributes Rs.1.5 lakh crore (6% of GSVA) and ranks as the 5th largest sector. It employs 41.1% of the rural workforce. In 2021-22, the state had 92.3 lakh farmers cultivating 64.6 lakh hectares of land. Notably, 93.5% of these farmers (86.3 lakh) are small and marginal, collectively farming 62.7% of the total cultivated area, with an average landholding size of only 0.7 hectares.
- Tamil Nadu’s 62% of the total cropped area includes major food grains, like paddy, maize, jowar, bajra, ragi, and millets, while non-food crops such as oilseeds, sugarcane, and cotton account for the remaining 38%. Paddy continues to dominate the cropping pattern, with its share in the total cropped area increasing from 32.1% in 2019-20 to 34.4% in 2023-24.
- The state’s consumption of fertilizers increased by 1.03 lakh MT to 10.68 lakh MT in 2023-24 from 9.65 lakh MT in 2019-20. Power consumption in agriculture also increased by 4146 million units to 17,957 million units and from 13,811 million units during the same period. The state government has allocated Rs.7,216 crore for the subsidy on three phases of free power in 2024-25 which needs to be rationalized by undertaking institutional reforms to eliminate power thefts and losses.
- The rise in the productivity of key crops in Tamil Nadu has been largely driven by the extensive use of chemical fertilizers and groundwater. The state has a total of 268 cold storage units with a combined capacity of 19,856 metric tonnes which is still inadequate given the expansions.
- The state’s organic farming has nearly doubled, rising from 5,255 in 2019-20 to 11,820 in 2023-24. Likewise, the area dedicated to organic farming has grown significantly, from 9,639 hectares to 34,000 hectares. All India level, this is highest in the country both number of organic farmers and area cultivate.
Given the strategic and geographic context, the state’s industrial landscape has been most watched out both at national and international levels.
- Tamil Nadu is an industrial powerhouse with diversification and contributes 11.90% to India’s manufacturing GDP and leading the nation in terms of the number of factories. The state aims to increase its exports to $100 billion by 2030. The value of merchandise exports from Tamil Nadu increased by $21.88 billion (72.90%) to $51.89 billion in 2024-25 from $30.01 billion in 2019-20. Tamil Nadu ranks 3rd in the country for merchandise exports, following Gujarat ($134.4 billion) and Maharashtra ($67.21 billion).
- The state’s manufacturing sector grew at 8.33% between 2021-22 and 2023-24, while the construction sector expanded by 9.03%. Several sub-sectors, including transport equipment, rubber and plastic products, motor vehicles, trailers, semi-trailers, and chemicals, recorded double-digit growth.
- With 35.56 lakh Udyam-registered Micro, Small, and Medium Enterprises (MSMEs), Tamil Nadu ranked 2nd nationally in 2023-24. Of these, 10.69 lakh MSMEs were in manufacturing, while 24.87 lakh were services-oriented. These MSMEs provide employment to 2.56 crore workers in the state.
- In 2023-24, Tamil Nadu’s total workforce of 33.31% was engaged in industrial activities, with 15.97% in manufacturing and 17.2% in construction. According to the Periodic Labour Force Survey (2023-24), 54.63% of the total workforce in urban Tamil Nadu is employed in services, significantly higher than the national average of 28.42%.
- The State has over 3.6 crore registered vehicles including 0.14 crore transport vehicles and 3.45 crore non-transport vehicles. Among these 3.03 crore are two-wheelers.
Let’s look at the services sector in the state where urbanization plays a major role.
- According to a state economic survey, Tamil Nadu is the 2nd most urbanized state (54.13% in 2024) after Kerala. In 2023-24, 54.63% of Tamil Nadu’s urban workforce was employed in the service sector, close to the national average of 58.07%. Among them, 16.28% were engaged in trade and motor vehicle repair, 7.53% in transport and storage, 6.28% in information and communication, 5% in education, 4.86% in accommodation and food services, 2.84% in financial and insurance services, and 11.84% in other services.
- The service sector in Tamil Nadu has demonstrated strong recovery post-pandemic. Between 2021-22 and 2023-24, the sector grew at 7.97%, driven by rapid expansion in real estate (9.41%), trade, repair, hotels, and restaurants (7.98%), and transport and storage (7.67%).
- Employment generation is crucial for economic growth and social stability. In 2019-20, Tamil Nadu’s Labor Force Participation Rate (LFPR) for individuals aged 15-59 years was 63.3%, as compared to the all-India average of 56.9%. By 2023-24, it had risen to 64.6%, slightly surpassing the national average of 64.3%.
The state has a population of 8.3 crore and has been facing huge challenges in urban mobility. The total number of public transport buses were only 20,260 in 2023-24, but the passengers traveled daily in public transports were 1.76 crore, an increase from 1.31 crore in 2019-20 (an increase of 34.35%).
The State Economic Survey highlighted that the state “must address the challenges posed by an aging population through healthcare innovations and enhanced social security measures.” The state is also facing uncontrolled social sector expenditure which has “steadily increased its social sector expenditure, which rose by Rs. 36,141 crore (45.25%) to Rs.1.16 lakh crore in 2023-24 from Rs.79,859 crore in 2019-20.” There are also huge regional imbalances in terms of access to basic facilities and overall standards of livings.
It must be noted, that the state has a poverty ratio of just 1.43% in 2022-23. Also, the state ranks 4th among major states in terms of average monthly per capita consumption expenditure for both rural and urban areas, consistent with its position as the 4th highest in annual per capita income. However, the state’s welfare measures are continuous and without target-oriented, resulting in huge leakages in subsidies of food, fertilizers, electricity, cash doles, etc. The survey has not provided detailed statistics for district-wise analysis of key parameters.
The state’s economy is burdened by significant challenges, including institutional governance issues and a economic disparity between rural and urban regions. Barring a few cities like Coimbatore, Madurai, Tiruchirappalli, Tiruppur, and Salem, all other cities like Tirunelveli, Dharmapuri, Villupuram, Perambalur, Ramanathapuram, Thuthukudi, etc. are still deprived without major industrial and services sector activities for improving standards of living of people.
B.Chandrasekaran is an Economist and Founder Chairman of the AgaPuram Policy Research Centre, Erode.
Views expressed by the author are personal and need not reflect or represent the views of the AgaPuram Policy Research Centre.