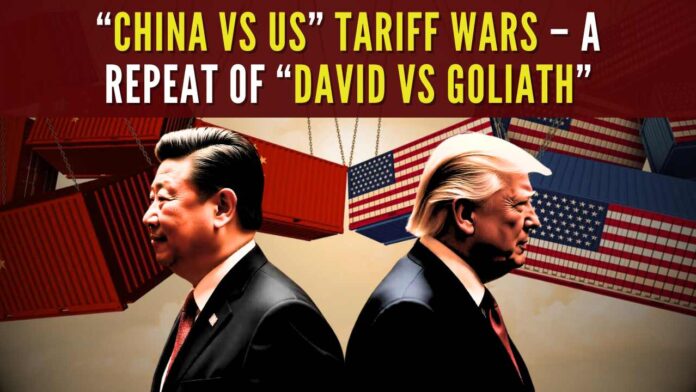
“China Vs US” Tariff Wars – A Repeat of “David Vs Goliath”
Highlights of Tamil Nadu’s First Economic Survey – 2024-25 “China Vs US” Tariff Wars – A Repeat of “David Vs Goliath” by Shanmuganathan N May 2, 2025 Indian Economy, Indian Liberals, World Economy Like the David-Goliath battle, China is poised to emerge victorious—once economic fundamentals are clear, it’s evident the real sinking ship is the US economy The world is in the middle of an escalating tariff war between US and China. The reverberations have been felt in most markets worldwide, and with no signs of a backdown by either country, the road ahead appears murky. However, that is only if one does not understand the principles of trade, currencies, and economics. As I see it, there is only one way this war will end – By China replacing the US as the dominant economic force on this planet and the US Dollar being replaced by Gold as the world’s reserve asset. The competitive advantage that China has created will stay for decades, similar to the US enjoying the dominant position during the entirety of the 20th century. Another definitive consequence of the trade wars is going to be downgrading of US treasuries from what is seen as the safest asset on the planet today to several notches below the current grade. The end game would be when the treasuries get downgraded to “near junk” status, but that is still a few years away. The decline of the US – both the economy and the Dollar – started almost very early in the 20th century, i.e., 1913, with the formation of the US Federal Reserve. But there was so much momentum and lead that the US had built up over the previous century under the classical gold standard that the decline was hardly noticeable. Similar to what Max Weber outlines in his chronicle of the decline of the Roman Empire, the culture of rugged individualism and liberty that the US was known for was conquered from within. The seeds of the precipitous part of the decline were sown much later in 1971 with the closure of the Gold Window. This ability to create “currency out of thin air” provided a carte blanche to the US Government to expand its powers within and outside the US. This growth in government came at the expense of the private sector, which is the productive part of the economy. This restraint of gold on the government was first unshackled in 1913 with the formation of the Federal Reserve – and eventually removed entirely in 1971. Many readers may not be aware that the US Government was funded almost entirely through Tariffs on imports until 1914. Income Tax was introduced as a “soak the rich” plan to eliminate tariffs that were paid for by everybody, and instead, a small fraction of the population would pay Income Taxes. Donald Trump is right when he says Tariffs were used to fund the Government entirely at some point. But what he doesn’t know, or at least doesn’t reveal, is that Government expenses as a percentage of the economy used to be less than 2% at that point in time and not 24% as they are today. Trade – Who Benefits? With so much misinformation, it is better to start from the basics. At the outset, a trade benefits both parties involved in the transaction. When one buys a cake of soap from a retailer, it is because one prefers the soap to the currency used to purchase it. Similar is the case with the retailer who prefers your currency to the cake of soap. This is an immutable truth that trade benefits both parties involved, as otherwise, it would not happen. The trade occurs even in extreme cases of ransom/extortion because both benefit. A trade doesn’t imply that both parties benefit equally or even near equally. This is not only valid for the extortionist case above but also for legitimate transactions. For example, many customers have railed against NVIDIA for the exorbitant pricing using its “temporary” monopoly power in a specific category of chips. But in all these cases, it is indeed a voluntary transaction as NVIDIA is not forcing any company to buy its chips. Customers are buying ONLY because they are better-off with these “overpriced” chips than without. Similarly, the US imports products from China only because the citizens/residents/users benefit. The follow-on question should be obvious at this stage: If trade benefits both parties, does it stand to reason that “tariffs” hurt both parties? Of course, yes. But in very unequal ways, as I will explain in this article. Now, before getting into the details of tariffs, it’s good to correct certain misperceptions regarding the popular biblical fable of “David vs Goliath”. The usual narrative of a “victory of the underdog” is a complete misrepresentation. The truth is that Goliath never stood a remote chance of defeating David in this battle. Before explaining, think of how to defeat Bruce Lee in a one-on-one duel: the answer is simple. While Bruce Lee might come with his karate paraphernalia, you go with a loaded rifle that has a 100m range, and shoot before Bruce Lee gets anywhere near you. Another example, how can one defeat Messi? Simple again: engage him in a game of chess. The path to victory lies in making the opponent’s strengths irrelevant in the battle. Change the frame of reference. That’s what happens in David Vs Goliath as well. The latter, Goliath, is a lumbering giant figure who comes to the battle with heavy armour, shields, and swords – essentially prepared for a short-range combat. David is an expert at defending his flock of sheep from lions and wolves using his sling with devastating effect. David can very accurately aim from hundreds of yards away and that’s exactly what happens in the famed battle. Goliath lasted all of a few seconds and did not stand a chance of getting anywhere near David to use his sword. For somebody who understands military warfare, Goliath
“China Vs US” Tariff Wars – A Repeat of “David Vs Goliath” Read More »