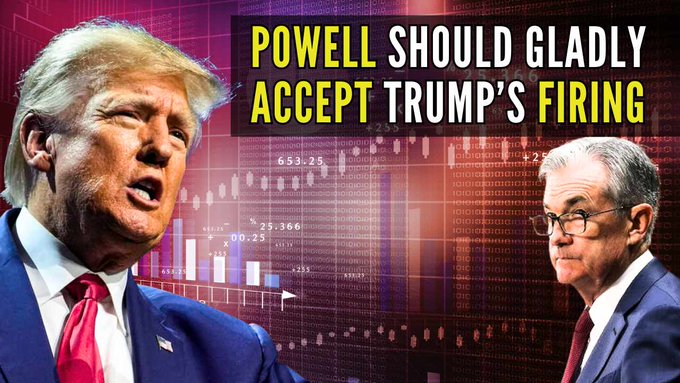
Powell Should Gladly Accept Trump’s Firing
Powell Should Gladly Accept Trump’s Firing Powell Should Gladly Accept Trump’s Firing by Shanmuganathan N July 30, 2025 Indian Economy, World Economy If Powell had any sense for what lies ahead, he would accept Trump’s firing gladly. Accompanied by the academic protests lamenting the lack of the Fed’s independence, etc, for the record books. If Trump had any sense for what lies ahead, he would allow Powell to remain in the chair and blame him subsequently when the US Housing Bubble 2.0 comes crashing down. Trump can at least have the satisfaction of saying “I told you so”. Why is Trump desperate to get the Fed funds rate down to 1% from the current 4.25 to 4.50% range? Two massive icebergs are on an imminent and direct collision course with the US Economy at this juncture, and these are: Bursting of the US Housing Bubble 2.0 Interest Expense as a % of Federal Income Headed into Uncharted Waters As Trump sees it, the only way to avoid the above issues is to lower the interest rates substantially. Readers should be aware that the current rate, aside from the ZIRP era following the GFC in 2008, is low from a historical perspective. But even these are not sufficient to maintain the bubbles. Trump Challenge 1 – The Housing Bubble 2.0 The peak of the median housing prices in the current cycle occurred in Q4 2022 at $442,600. As of Q1 2025, the median sale price was $416,900. While a 5% drop is not a significant correction, two factors do not bode well for a meaningful recovery: that this drop has occurred over 30 months, and the persistent high mortgage rates are keeping affordability at an all-time low for US consumers. The previous 30-month period’s drop in housing prices occurred from Q4 2017 to Q2 2020 (a period during which the Fed funds rate increased from 1% to 2.5%), after which the COVID-19 stimulus and a return to ZIRP reversed the declining trend in housing prices. Trump wants to orchestrate a similar move now – reduce interest rates and inject massive fiscal stimulus through the Big Beautiful Bill. The only other period in which we have witnessed an extended drop in housing prices this century was during the 2008 housing bubble. Between Q1 2007 and Q1 2009, housing prices declined by more than 20%. Only a combination of ZIRP and QE – both unprecedented monetary measures – halted this decline. So as far as Trump’s eye can see, the solution to the problem of a housing crisis is a combination of ultra-low interest rates and expansion of the Fed balance sheet. The fact that, on the two occasions this was done – done after 2008 GFC and during Covid-19 – there were no deleterious consequences to talk about – would probably make Trump conclude that this extraordinary monetary stimulus can be done today as well. But why can’t the housing process recover without the above measures? The housing price increases have far outpaced the growth in median incomes. The Atlanta Fed’s Home Ownership Affordability Index (HOAI) – a composite index that takes into account housing prices, principal and interest payments, as well as taxes and insurance – is at an all-time low. This index is even below the levels that led to the bursting of the housing bubble in 2008. A level of 100 indicates that housing prices are affordable to buyers, given the current mortgage rates. The current score as of Apr 2025 is 65 – well below what makes the median house affordable to the median buyer. There are only two acceptable ways to increase affordability – either increase median wages or reduce interest rates. As Trump sees, all roads seem to lead to lower interest rates. There is, of course, a third way (an unacceptable one, though) to increase affordability – a dramatic decline in housing prices. Given that a housing bust will be accompanied by a decrease in employment, wages, and taxes, housing price declines must rival the effects of the above to lead to an increase in the Affordability Index. A drop of at least 30% would be required to bring the index into the affordable category. A 20% decline caused the 2008 crisis, and that too, from much lower levels of housing prices. Once again, it is easy to see why Trump is arguing vehemently in favour of substantially lower rates to stimulate the housing market. Trump Challenge 2 – Interest Expense as a % of Federal Income If the housing bubble bursting is an imminent danger in the months ahead, the Interest expense of the federal government is a current millstone around Trump’s neck. From less than 20% during Q1 2022, the interest expense as a % of Federal revenues has increased to 35% during Q1 2025. Readers might recall that the Fed hiked rates from nearly 0% during March 2022 to nearly 5.5% by July 2023. The US National debt has also increased from $30 trillion in Q1 2022 to more than $37 trillion today. A legitimate question would be whether this is not the first time we have crossed 30%, as there were two earlier periods: the 1980s decade, when this averaged more than 40%, and the years immediately prior to the 2008 GFC. 1980s was a period in which the debt-to-GDP was less than 40% – less than one-third the current debt-to-GDP ratio of 125%. The interest expense was high primarily because the Fed funds rate was in the double digits. As these rates declined, despite the debt growing faster than the GDP throughout the 1980s, the government was quite able to manage the interest obligations without threatening to take over the Fed’s primary role. Today, we are in a situation that the Fed would prefer to call “Fiscal Dominance,” i.e., the rates must necessarily be held low due to excessive government debt. Regarding the years preceding the GFC in 2008, the debt-to-GDP ratio was still less than 60%, allowing
Powell Should Gladly Accept Trump’s Firing Read More »