The International Monetary Fund (IMF)’s 2025 Annual staff report for India has once again given the country’s national accounts, including Gross domestic product (GDP) data, a C-grade, indicating that the statistics have “some shortcomings” that hinder effective economic surveillance. IMF has recommended revising the base year which is a long pending due. We are currently using 2011-12 as our base year from 2015. It’s been almost 10 years since we revised the base year.
The Ministry of Statistics and Program implementation (MoSPI) is taking steps to revise the base year to 2022-23. By end of February 2026, the new estimates will be released based on the new base year and within one year the back dated GDP data will also be released.
Measuring GDP correctly is important because it affects government policy, budgeting and economic planning. In India, GDP measurement has become more challenging as the economy has changed significantly over the years with the rapid growth in services, digital activities and a large informal sector.
These changes have sometimes led to differences between GDP estimates calculated using the Production (GVA) method and the expenditure method. To improve the consistency and reliability of GDP numbers, India has started moving towards the use of Supply-Use Tables (SUT) which helps link production and spending more clearly within the economy.
GDP is nothing, but the total value of the final goods and services produced within the country. It can be calculated in 3 methods: 1) Production Method; 2) Expenditure method; 3) Income method.
1. Production (GVA) Method:
India primarily uses Production method to calculate GDP. For this, first we need to calculate the Gross Value added (GVA). This is nothing but how much value has been created by the respective stakeholders in the economic process.
Let us say, A farmer cultivated 1 KG of wheat grains sold to a miller for 40 rupees. The value added by the farmer is calculated as 40 rupees. Now, the miller using his machinery manufactures wheat flour from those grains. It will be sold to the baker for 80 rupees. The value added by the miller is 40 rupees (Output – Input cost = 80 – 40). The baker prepares bread using wheat flour and sells them for 100 rupees. The value added by the baker is 20 rupees (100-80 = 20).
The total GVA can be calculated as 40+40+20 = 100 rupees.
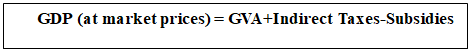
Once the GVA was calculated we need to add the net tax levied on the products and services as well.
Expenditure Method:
This method measures GDP by adding up all the spending on final goods and services produced within a country during a given period.
![]()
Where,
C – Consumption: Spending by households on goods and services, examples like Food, clothing, rent, healthcare, entertainment, etc.
I – Investment: Spending by businesses on capital goods
Example: machinery, buildings, inventories, etc.
Also includes residential construction.
G – Government Expenditure: Government spending on public services
Example: salaries of government employees, defense, infrastructure, etc.
Does NOT include transfer payments (like pensions, subsidies).
(X – M) – Net Exports
X = Exports (what the country sells abroad)
M = Imports (what the country buys from abroad)
Though India uses production method to publish the official GDP figures, the MoSPI also calculated GDP in expenditure method as the GDP calculated through this method depicts the demand from the economy. Theoretically, the GDP Calculated from both methods should be equal. But in reality, GDP through production method greater than the GDP calculated through expenditure method.
In India, it is very difficult to capture the minute expenditure data with the existing systems of 1.4 billion populations. But we get the reliable production data through robust systems like MCA-21 filings, GST returns which companies need to file for compliance purposes. Also, due to the large share of informal economy, it is very difficult to capture every transaction. Till now, we have reported the variance of GDP calculated from both the methods as discrepancy.
![]()
Eventually, this discrepancy made our national accounting look feeble on global stage. Now, to tackle this discrepancy issue, MoSPI integrated Supply use tables while calculating the GDP. SUTs are a core framework in national accounting that ensures internal consistency in the measurement of GDP by systematically linking what is produced in an economy with how that production is used. Simply, if an economy produces a certain value of goods and services, where exactly does the output go?
Let us consider a simple analogy of economy as a water distribution network. Supply is the total amount of water pumped into the system and use as how that water is consumed by households, industries as inputs, governments or exports outside the system. If the system pumps 100 litres of water, then exactly 100 litres must be accounted for in use, if only 92 litres are observed as being used, the system is said to have a leak. Earlier GDP compilation methods allowed such leaks to exist as statistical discrepancy. SUTs, however, do not allow water to disappear. They require every unit supplied must be matched with a corresponding use.
For an economy as large and diverse as India where many activities happen outside the formal system and data comes from multiple sources, it is very difficult to ensure that production and spending numbers always match. SUTs offer a structured way to bring these different data points together. Their use marks an important step towards making India’s GDP estimates more consistent and comparable with international standards.
But there are few shortcomings with the SUTs. The increasing use of administrative data such as GST filings and company returns introduces additional sources of error. These datasets are often affected by under-reporting, misclassification of activities and compliance gaps. For example, A firm producing metal components may report its activity under a broader manufacturing category in tax filings. When such data are incorporated into SUTs, sector-level output may be misallocated even if the overall GDP remains unchanged. This leads to inaccuracies in industry-wise estimates, which are often used for policy analysis.
Under earlier methods, differences between production based and expenditure-based GDP estimated appeared as an explicit discrepancy. SUTs absorb those differences during the balancing process, resulting in cleaner headline numbers. However, this also means that the size and location of underlying uncertainties are less visible to external analysts. While the final GDP estimates appear more coherent, it becomes harder to assess where adjustments were made and how sensitive the results are to underlying assumptions.
Recent discussion paper released by MoSPI titled, “Methodological improvements in compilation of aggregates of National accounts” in view of upcoming GDP methodological and base revision tried to address these short comings of quality and classification in the administrative data is the timely measure.
The Author is Public Policy Fellow at AgaPuram Policy Research Centre, Erode
The views expressed by the author are personal and does not reflect or represent the views of the AgaPuram Policy Research Centre, Erode.