Indian Economy

Another Caste Count for…? 

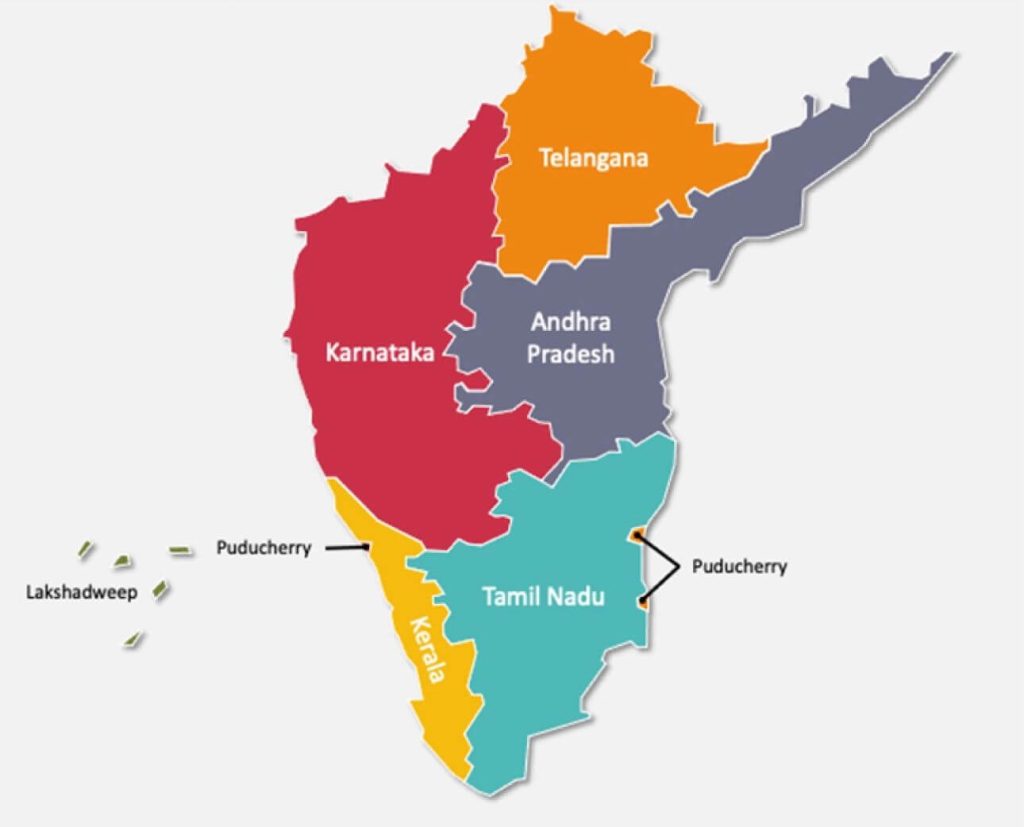
Another Caste Count for…? Another Caste Count for…? Ghanshyam Sharma May 19, 2025 Cultural Economics, Indian Economy, Public Policy                                                                                        Herd instinct If the primary purpose of conducting the caste census is to justify higher reservations for SCs/STs/OBCs, then this information already exists. The National Family Health Survey (NFHS) suggests that the share of SC/ST/OBC sections in the country’s population exceeds 50%. The NFHS are nationally representative periodic surveys that provide information on the caste composition of the population. This data can be used to estimate the caste composition at the district and state level. NFHS estimates are based on scientific sampling methods that help to infer information about the population based on a sample of households. NFHS provides reliable estimates often used in scientific research, government reports, and the industry. The reported results from the Telangana Caste Census are remarkably similar to the NFHS estimates. For example, according to NFHS, 27.8% of the Telangana population identifies as SC/ST, 54.1% as OBC, and 17.4% as general category. Telangana Caste Census reports that 27.8% of the population identify as SC/ST, 56.7% as OBC, and 16% as general category. The NFHS data is available for all other states. For example, NFHS indicates that in UP, the share of SC/ST/OBC population in the total population is 78.9%. In Gujarat, this share is 74.7%. In the states of Maharashtra and Karnataka, this share is 56.3% and 85.7% respectively. Since NFHS also asks people the religion they most identify with, this caste data can be seen across religions as well. Besides, the NSS / NFHS surveys also collect rich information on various social and economic indicators such as wealth, education, employment, health, alcohol use, tobacco use, condition of women, etc. Since these surveys have been conducted over time, they have been used to check for convergence in the economic and social status across caste groups. Several prominent studies like K Munshi (2019) and Hnatkovska & Lahiri (2012) have documented that while gaps in economic status between caste groups exist, there has been a remarkable convergence over time. In other words, the SC, the ST, the OBC, and the General category groups have become more equal. The socially marginalized sections of the population are catching up. It is unrealistic that the proposed Caste Census would collect such diverse data on socio-economic indicators for the entire country. Even if the caste census collects such information, it will be available every ten years. NFHS / NSS can be done every 3-4 years. Moreover, NFHS / NSS / India Human Development Survey data is already used in public policy-making. In that case, what does the proposed caste census intend to achieve? Will the caste census collect data on the population size and socioeconomic indicators for every sub-caste (which NSS/NFHS doesn’t do)? What will this information be used for? If the purpose of the caste census is to unbundle the castes within the SC, the ST, and the OBC groups, this can stir a hornet’s nest. The caste census will likely rattle the SC, ST, and OBC groups which receive caste based benefits, rather than the general castes. It may pit social groups within the broader ST, SC, and OBC communities against each other. The caste census can be used to strip a caste or a sub-caste of its reservation privileges if its social and economic indicators are comparable to the general category. Caste census can provide information to fix the quantum of reservation based on the population size or economic status of each caste and sub-caste within the reserved categories. This will be a deviation from the current policy where all the castes categorized as ST have equal claims at 7.5% reservation. Even if this is not the intended objective of the caste census, it will motivate demands from caste groups for higher reservations within the reserved seats. Census data can selectively target specific social groups within the broader Scheduled Caste and Scheduled Tribe categories. For example, the Pre-Matric Scholarship Scheme for ST Students be replaced with the Pre-Matric Scholarship Scheme for only Meena students leaving out other ST caste groups. Despite its promise of superior targeting of specific social groups based on social exclusion, it is also impossible for a caste census to realistically capture social stratification. This is because caste isn’t the only factor that socially stratifies India. Caste intricacies intersect with class, language, and gotra differences. There are hundreds or even thousands of sub-castes within Brahmins. Saraswat Brahmins in Tamil Nadu may be similar to other Tamil Brahmins as compared to Saraswat Brahmins from Uttar Pradesh. There seem to be no substantive reasons for conducting the census. The Government of India hasn’t specified the objectives of conducting the Caste Census. Most purposes of conducting a caste census are speculative. The UPA and NDA governments have not disseminated the 2011 caste census data. Bihar and Telangana have recently conducted caste censuses. But neither have they disseminated census data, nor framed policies based on it. Therefore, it is worthwhile to ponder over the usefulness of conducting a caste census.  The author is currently an Associate Professor of Economics at RV University, Bengaluru.  The Author is a Research Fellow at AgaPuram Policy Research Centre.  Views expressed by the author are personal and need not reflect or represent the views of the AgaPuram Policy Research Centre. This article was originally first published by The Economic Times at https://economictimes.indiatimes.com/opinion/et-commentary/another-caste-count-for-/articleshow/120906704.cms

Another Caste Count for…?  Read More »

India’s Cultural and Creative Aspirations for Vikist Bharath

India’s Cultural and Creative Aspirations for Vikist Bharath India’s Cultural and Creative Aspirations for Vikist Bharath Dushyant Meher May 2, 2025 Cultural Economics, Indian Economy, Public Policy Cultural and Creative Economy is an emerging economic field that offers not only well meaning to creative pursuits but also wealth and soft power. It is like invoking goddesses—Saraswati, Laxmi, and Durga. Culture and creativity are akin to the collective psyche of our nation, which can be seen in every nook and corner of the country as a civilisation, including in grand form during events such as Republic Day or the G20 Summit. The United Nations Conference on Trade and Development (UNCTAD) defines creative industries as creation, production, and distribution cycles that leverage creativity and intellectual capital. These industries encompass knowledge-based activities focusing on culture and heritage, including tangible and intangible creative products with economic value. The creative economy is an evolving concept that drives economic growth, supports job creation, and fosters social inclusion and cultural diversity. It emphasises integrating economic, political, cultural, and social aspects with technology and intellectual property. The latest edition of Creative Economy Outlook 2024 by UNCTAD observes that the creative economy is rapidly growing, especially in developing countries, and that it contributes significantly to economic development and job creation. The creative industry in India is a self-organizing sector. Indian government fully recognizes the importance of the sector including the culture and cultural industries as sources of socio-economic development, livelihood generation, and wealth creation as well as the well-being of individuals. The creative sector overarches over two dozen or more departments, ministries, and national institutions. By engaging with business organizations, institutions, and experts, the scope and viability of the sector are being explored. However, given the nature of complexities- defining and mapping the creative sector for evidence-based policymaking poses a formidable challenge. Nevertheless, the sentiment of prioritising the sector echoes in the address of the Prime Minister while inaugurating the World Heritage Committee meeting in New Delhi last year and this year Waves Summit 2025 at Mumbai. He highlighted the vision of linking heritage with growth and development, the Orange Economy. He asserts that the cultural and creative industry would be an important factor in global growth. Eventually, industry bodies and associations have been voicing collective actions towards a policy for the creative sector. As reported by Creative Economy Outlook 2024; some of India’s advantageous positions include – India tops in film producer position, contributing 29% of the global volume in 2022 and record box office revenues reaching around US$ 1.4 billion in 2023. Among developing economies, India is at 3rd after China, and Hongkong (SAR) in exporting creative goods in 2022. India exported 21 billion USD which is a 2.9% share of world export of creative goods. It is 4.6% of the total exports of our country. India is in 4th position in the world (both developed and developing countries) after the USA, Germany, and Japan in the publishing industry. India is on top amongst developing countries both in terms of revenue and number of ISBN registrations (281 091) in 2022. India’s growth in the video games segment is projected to grow at 18.3%. It is one of the top ten creative goods importers in 2022 with an import record of 5.6 billion USD which is a 0.9% share of world imports of creative goods and a 2.2% share of creative goods from the country’s total imports. Some of the concerns are also being raised by some of the multilateral institutions with regard to India. According to ILO data in Arts, entertainment, and recreation, the average share of women in the creative industries fluctuates from 80.5% in the Dominican Republic to 6.5% in India, alongside a global average of around 38% (ILO, 2024). A study conducted by ADB about India’s economy finds that the concentration of creative jobs is significantly higher in urban areas, with a substantial 67.1% of all creative workers residing there. In contrast, rural areas have a much lower proportion of creative workers at only 29.6%. Moreover, while the creative workforce makes up 8% of India’s overall employment, it constitutes approximately 17% of total urban employment but just 4.1% of total rural employment (Asian Development Bank, 2022b). The UNCTD reports that several economies, especially developing economies including India do not have adequate services trade data to calculate creative services exports. However, this does not mean India doesn’t export creative services. Lack of robust regulation and enforcement, the Indian entertainment sector experiences an annual revenue loss of approximately US $2.8 billion due to digital piracy. Culture unites all and is a tool for track-II diplomacy. Given the size and quality of our diaspora; it continues to enable India as a soft power. It is becoming quite foundational in India with the implementation of the New Education Policy that guarantees equal access to creative and cultural experiences to innovate through traditional, conventional as well as in new technological mediums like AI. For expansion of these creative experiences beyond socio-cultural towards the viable market; component-wise dissection of the creative sector is required to plan for multidimensional interventions. This is possible or viable even in the absence of a clear definition. Innovations and acceleration of activities with market regulations and effective enforcement can help make it a robust sector. A new report by the Boston Consulting Group (BCG), titled “From Content to Commerce: Mapping India’s Creator Economy”, set to be launched tomorrow (3rd May 2025) at WAVES 2025 in Mumbai, will reveal that India’s creators currently influence over $350 billion in consumer spending annually — a figure expected to surpass $1 trillion by 2030. The report highlights that India is home to 2 to 2.5 million active digital creators, defined as individuals with over 1,000 followers. The creator ecosystem’s direct revenues, estimated at $20–25 billion today, are projected to reach $100–125 billion by the end of the decade. Creators influence more than 30% of consumer decisions, shaping $350–400 billion in spending today. Moreover, policymaking may be a long and lengthy process

India’s Cultural and Creative Aspirations for Vikist Bharath Read More »

“China Vs US” Tariff Wars – A Repeat of “David Vs Goliath”

Highlights of Tamil Nadu’s First Economic Survey – 2024-25 “China Vs US” Tariff Wars – A Repeat of “David Vs Goliath” by Shanmuganathan N May 2, 2025 Indian Economy, Indian Liberals, World Economy Like the David-Goliath battle, China is poised to emerge victorious—once economic fundamentals are clear, it’s evident the real sinking ship is the US economy The world is in the middle of an escalating tariff war between US and China. The reverberations have been felt in most markets worldwide, and with no signs of a backdown by either country, the road ahead appears murky. However, that is only if one does not understand the principles of trade, currencies, and economics. As I see it, there is only one way this war will end – By China replacing the US as the dominant economic force on this planet and the US Dollar being replaced by Gold as the world’s reserve asset. The competitive advantage that China has created will stay for decades, similar to the US enjoying the dominant position during the entirety of the 20th century. Another definitive consequence of the trade wars is going to be downgrading of US treasuries from what is seen as the safest asset on the planet today to several notches below the current grade. The end game would be when the treasuries get downgraded to “near junk” status, but that is still a few years away. The decline of the US – both the economy and the Dollar – started almost very early in the 20th century, i.e., 1913, with the formation of the US Federal Reserve. But there was so much momentum and lead that the US had built up over the previous century under the classical gold standard that the decline was hardly noticeable. Similar to what Max Weber outlines in his chronicle of the decline of the Roman Empire, the culture of rugged individualism and liberty that the US was known for was conquered from within. The seeds of the precipitous part of the decline were sown much later in 1971 with the closure of the Gold Window. This ability to create “currency out of thin air” provided a carte blanche to the US Government to expand its powers within and outside the US.  This growth in government came at the expense of the private sector, which is the productive part of the economy. This restraint of gold on the government was first unshackled in 1913 with the formation of the Federal Reserve – and eventually removed entirely in 1971. Many readers may not be aware that the US Government was funded almost entirely through Tariffs on imports until 1914. Income Tax was introduced as a “soak the rich” plan to eliminate tariffs that were paid for by everybody, and instead, a small fraction of the population would pay Income Taxes. Donald Trump is right when he says Tariffs were used to fund the Government entirely at some point. But what he doesn’t know, or at least doesn’t reveal, is that Government expenses as a percentage of the economy used to be less than 2% at that point in time and not 24% as they are today. Trade – Who Benefits? With so much misinformation, it is better to start from the basics. At the outset, a trade benefits both parties involved in the transaction. When one buys a cake of soap from a retailer, it is because one prefers the soap to the currency used to purchase it. Similar is the case with the retailer who prefers your currency to the cake of soap. This is an immutable truth that trade benefits both parties involved, as otherwise, it would not happen. The trade occurs even in extreme cases of ransom/extortion because both benefit. A trade doesn’t imply that both parties benefit equally or even near equally. This is not only valid for the extortionist case above but also for legitimate transactions. For example, many customers have railed against NVIDIA for the exorbitant pricing using its “temporary” monopoly power in a specific category of chips. But in all these cases, it is indeed a voluntary transaction as NVIDIA is not forcing any company to buy its chips. Customers are buying ONLY because they are better-off with these “overpriced” chips than without. Similarly, the US imports products from China only because the citizens/residents/users benefit. The follow-on question should be obvious at this stage: If trade benefits both parties, does it stand to reason that “tariffs” hurt both parties? Of course, yes. But in very unequal ways, as I will explain in this article. Now, before getting into the details of tariffs, it’s good to correct certain misperceptions regarding the popular biblical fable of “David vs Goliath”. The usual narrative of a “victory of the underdog” is a complete misrepresentation. The truth is that Goliath never stood a remote chance of defeating David in this battle. Before explaining, think of how to defeat Bruce Lee in a one-on-one duel: the answer is simple. While Bruce Lee might come with his karate paraphernalia, you go with a loaded rifle that has a 100m range, and shoot before Bruce Lee gets anywhere near you. Another example, how can one defeat Messi? Simple again: engage him in a game of chess. The path to victory lies in making the opponent’s strengths irrelevant in the battle. Change the frame of reference. That’s what happens in David Vs Goliath as well. The latter, Goliath, is a lumbering giant figure who comes to the battle with heavy armour, shields, and swords – essentially prepared for a short-range combat. David is an expert at defending his flock of sheep from lions and wolves using his sling with devastating effect. David can very accurately aim from hundreds of yards away and that’s exactly what happens in the famed battle. Goliath lasted all of a few seconds and did not stand a chance of getting anywhere near David to use his sword. For somebody who understands military warfare, Goliath

“China Vs US” Tariff Wars – A Repeat of “David Vs Goliath” Read More »

Distinguished Indian Economists-Initiative of Azim Premji University

Distinguished Indian Economists-Initiative of Azim Premji University Distinguished Indian Economists-Initiative of Azim Premji University Mr B Chandrasekaran, Founder Chairman, AgaPuram Policy Research Centre (APRC) has contributed to the Initiative of Azim Premji University on Prof S Ambirajan’s life and works. This project explores the contributions of modern Indian economists, whose ideas and analyses have not only shaped India’s economic trajectory but also generated a deeper understanding of development and growth in the country. Chandrasekaran Balakrishnan April 17, 2025 Indian Economy, Indian Liberals Full Article is at: https://azimpremjiuniversity.edu.in/indian-economists/s-ambirajan                               https://azimpremjiuniversity.edu.in/distinguished-indian-economists

Distinguished Indian Economists-Initiative of Azim Premji University Read More »

War Against Tariffs, Not a Tariff War

War Against Tariffs, Not a Tariff War War Against Tariffs, Not a Tariff War Ghanshyam Sharma April 17, 2025 Economic Reforms, Indian Economy, World Economy An elderly person watches the stock prices on a digital screen at the Bombay Stock Exchange (BSE) building in Mumbai. Indian equity markets slipped during Thursday’s trade after Trump announced tariffs on foreign imports to the US. Photo: PTI India has the third highest tariff rates among major countries. Iran and Venezuela are the other major countries with higher tariffs than India. According to the World Bank, India imposes a weighted average tariff rate of 11.5%. In comparison, China has a tariff of 3%, Pakistan has a tariff of 8%, Vietnam has a tariff of 1%, and Sri Lanka has a tariff of 4.4%. The countries in the European Union have a tariff of 1.3%. Australia has a tariff of 1%. The US has a tariff of 1.5%. Tariffs make imported goods expensive and force citizens to pay higher prices for low-quality local goods. For example, in India, laptops are 30% more expensive than in the United States. An average American is 33 times richer than an average Indian (USD 82,000 vs USD 2,500 GDP per capita). Coupled with this growing income disparity, such a steep price differential hampers skill development among youth. It’s been a fear for centuries that foreign competition threatens local industry and employment. In 1845, Frederic Bastiat petitioned the French government to protect the domestic candle manufacturing industry from foreign competition – the Sun. Bastiat argued that the Sun lights up people’s homes for free and reduces the candle demand. If the government could enact trade barriers such as prohibiting windows and blocking the Sun, people would be forced to purchase candles! Hence, protecting the domestic industry from foreign competition will increase demand, employment, and GDP. While Bastiat wrote a satire, a prominent labour union in the United States actually filed a grievance against goats in 2017. Western Michigan University had replaced the union members with goats to clear vegetation and landscape their campus. However, the labour union argued that the use of goats cost them their jobs and threatened their livelihoods. In a free world, people are paid somewhat proportionate to the value they add. Should we support policies that block the sun or bar the goats from grazing so people can have jobs even if these jobs add no value? Trade barriers such as tariffs do not contribute to human prosperity. They may generate employment in the short run but lead to long-term economic stagnation and decline. In reality, tariffs facilitate a transfer of resources from domestic consumers to affluent domestic industrialists. Tariffs safeguard the interests of domestic industrialists at the expense of common citizens. After the 1991 economic reforms, several business houses floundered in the face of foreign competition. The presence of tariffs eliminates competition for domestic industry and disincentivizes them from improving quality and reducing prices. Protected by tariffs, domestic industrialists use their resources to lobby with politicians rather than investing in research to increase competitiveness. Tariffs exist because domestic big businesses lobby for them. George Stigler (1982 Nobel Prize recipient in Economics) pointed out that big companies capture regulation at the expense of consumers. It is easier and more lucrative for a few big business houses to unite as an interest group and lobby for a favorable policy (such as tariffs). They face lower costs of coming together and a limited free rider problem. Further, the benefits are also concentrated. In contrast to big businesses, it is costly and difficult for millions of consumers to unite against unfair tariffs. The price increase due to tariffs is not enough to motivate them to skip their jobs or businesses to oppose the policy.  For example, while the United States imposes zero taxes on Indian drugs, India poses a 10% tax on US-made drugs. A 10% tax on imported drugs benefits a few pharmaceutical firms and hurts millions of Indian consumers. However, while the benefits accrue to a few pharma firms, the costs are distributed among millions of consumers. Hence, the people are unlikely to protest as it is rational for individuals to accept the unfair tariffs. India has been lowering tariffs since 1991. However, the tariffs have increased in the last 10 years. In 1991, India’s tariff rate on imports was 56.4%. India gradually lowered its tariffs to 26.5% in 2001. By 2015, India lowered the tariffs further to 7.3%. However, as per WTO estimates, the tariff rate had increased to 11.5% in 2022. In addition to increasing tariffs, India has increased non-tariff barriers to support organized producers. According to UNCTAD, India has increased the number of Non-tariff Measures (NTMs) against imports from 389 in 2012 to 582 in 2022. To make matters worse, India has increased the Frequency Ratio (the percent of imported products subject to NTMs) from 31.2% in 2010 to about 47%. It has also increased the Coverage Ratio (the percent of import value subject to non-tariff measures) from 42.5% in 2010 to 69 percent. Such measures have benefitted the organized producers at the cost of unorganized consumers. When India lowered tariffs in 1991, productivity, employment, and GDP growth increased. High-value jobs replaced the existing jobs. Several domestic firms became key players in global markets. Citizens were able to buy high-quality goods at lower prices. Therefore, India should lower its tariffs in response to President Trump’s threat of reciprocal tariffs. A stronger trade relationship between India and the United States will translate into an improved geo-political partnership between the two countries. Low import tariffs will benefit firms that manufacture exports as imported goods are used to manufacture exports. This may create short-term temporary job losses but will lead to long-term high-value employment and prosperity. The author is currently an Associate Professor of Economics at RV University, Bengaluru. The Author is a Honourary Research Fellow at AgaPuram Policy Research Centre.  Views expressed by the author are personal and need not reflect or represent the views

War Against Tariffs, Not a Tariff War Read More »

The Kumbhanomics 2025

The Kumbhanomics 2025 The Kumbhanomics 2025 Dr S Narayanan March 6, 2025 Cultural Economics, latest, State Economies Economic Pulse of the World’s Largest Gathering For India, a nation with one of the oldest civilizations, the Kumbh Mela is more than just a religious festival—it is a cultural, social, and economic spectacle that has endured for millennia. Held at the Triveni Sangam in Prayagraj, Uttar Pradesh, this grand event exemplifies the deep connection between culture and economic activity. It happened during a certain celestial alignment of the Sun, Moon, Jupiter and Saturn – a rare event occurring once every 144 years. The Maha Kumbh Mela 2025, spanning 45 days from January 13 to February 26, is estimated to have drawn a humungous 66.30 crore pilgrims across India and around the world, making it one of the largest religious congregations. It is also estimated that nearly 47% of India’s population of 140 crores visited this holy site. Prayagraj, also referred to as the “TIRTHRAJ”, has been a centre of spiritual and cultural significance for centuries. The Chinese Traveller Xuanzang, in 644 CE described Prayagraj as a region of immense natural beauty, prosperity and cultural depth attracting over 5 lakh people including the rulers and wealthy merchants. The over 2000 years old rituals of taking a holy dip in the Maha Kumbh Mela is believed to elevate spiritual thoughts. The confluence of Ganga, Yamuna and Saraswathi rivers at the Triveni Sangam adds to the sanctity of this unique location. Besides being a cultural and spiritual happening, the festival also creates immense economic activities for the region and the state, which is the crux of this piece. Mahakumbh Nagar: A Temporary City with World-Class Facilities To accommodate the massive influx of pilgrims, a temporary city with state-of-the-art facilities, Mahakumbh Nagar, was set up. Key infrastructure developments include: The renovation of 92 roads and beautification of 17 major roads, construction of 30 pontoons bridges using 3308 pontoons, erection of 800 plus multi-language signages (Hindi, English, and regional languages), Installation of 233 Water ATMs to provide pure drinking water 24/7, construction of 1.5 lakh mobile toilets, implementation of AI-powered crowd density monitoring system with over 350 experts at key locations, installation of 3000 plus CCTV cameras and drones, adoption of facial recognition technology, installation of water towers for fire safety, Employment of underwater drones capable of diving up to 100 meters to provide round the clock surveillance, usage of a dedicated app for real-time updates on crowd density, employment of 56 cyber warriors, availability of state-of-the-art Multi Disaster Response Vehicle for safety and disaster readiness, construction of temporary hospitals equipped with surgical and diagnostic facilities, and setting up of 3 temporary sewage treatment plants for river protection etc. Logistics and Infrastructure Managing a crowd of this magnitude involves strategic planning for transportation, accommodation, basic amenities like water, sanitation, food, and healthcare. The Swachh Bharat Mission has played a crucial role in ensuring cleanliness. The government welcomed the domestic institutions / think tanks / policy makers to make the next time bigger and better. Many research institutions, including over 20 global institutions like Harvard, Standford, London School of Economics, Gates foundation, Kyoto University, AIIMS, IIM Ahmedabad, IIM Bangalore, IIT Kanpur, IIT Madras, JNU were invited to cover the event, right from planning to execution. The Union Ministry of Housing and Urban Affairs has tied up with institutions of international repute to study waste management through Harvard Business School – Food and Beverage Management, operations of the event, inter-city connectivity, Multimodal transport Hubs and public transport system.  Standford University – Solid Waste Management, efficiency and waste disposal.  IIM – Indore – Internationals related to behaviour change, sanitation.  IFC – Gates foundation – -economic impact in six districts.   The event highlighted India’s prowess in efficiently and innovatively organizing the world’s largest human gathering. The state government also achieved a Guinness World Record in Ganga Cleaning Drive and Mass Cleaning Initiative which set new benchmarks in mass sanitation and environmental efforts. Economic Impact &Technological Innovations The governments have always recognized the economic potential of the Kumbh Mela. In 2019, the state government spent around Rs.3,700 crore, attracting 25 crore visitors. This year, the allocation was doubled to Rs.7,500 crore. Advanced technologies such as artificial intelligence, robotics, and expert consultations have been employed to ensure smooth execution. The government’s investment of Rs.7,500 crore is expected to generate revenue of around Rs.3 lakh crore.  Key innovations include: Accommodation options ranged from Rs.2,000/- to Rs.2,00,000/- catering to diverse visitors, including the President, Prime Minister, ministers, VIPs, and international guests. The event has also boosted tourism in nearby religious sites such as Ayodhya and the Kashi Vishwanath Temple, further stimulating local economies. The Union Ministry of AYUSH provided quality healthcare services to over 2.5 devotees at the site of the event. Over 15,953 metric tonnes of waste were removed from the Mela area to keep it clean and plastic-free. It is estimated that the state witnessed a GST growth rate of 11% and 14% growth in the months of January and February, respectively, during Mahakumbh, generating over ₹1,000 crore increase in GST collections over the corresponding period last year. Further, the Chief Minister has stated in the Assembly that the Mela has rewarded the state economically too. He stated that a boatman family earned Rs 30 crore in 45 days with 130 boats, at Rs 23 lakh per boat & approximately Rs 52,000 a day. A definitive estimate may be expected when the official growth figures are published. Faith to Finance Projections suggest this surge in religious and spiritual tourism would have generated over Rs. 3.5 lakh crore in revenue (more than USD 360 Million), significantly uplifting the state’s economic landscape, benefiting everyone from small-scale vendors like cycle-borne tea sellers, bike-pool operators, boatmen, pilgrimage guides, casual laborers to local traders and corporate stakeholders. The beneficiary sectors include food and beverages, religious offerings (such as lamps, idols, Ganga water, and incense sticks), pilgrimage guides, travel packages, ayurvedic products, and promotional merchandise. This multifaceted

The Kumbhanomics 2025 Read More »

High Tax Rates Do Not Translate into Higher Tax Revenues

High Tax Rates Do Not Translate into Higher Tax Revenues High Tax Rates Do Not Translate into Higher Tax Revenues Ghanshyam Sharma March 4, 2025 Economic Reforms, Indian Economy, Public Policy The irony of India’s high tax policy is that while it imposes the highest tax rates globally, it collects very low tax revenues compared to other countries. India has the highest GST of 28%. If we include cess and other charges, the actual tax rates are even higher.  However, India’s tax revenue as a percentage of GDP is only 11.7%. In contrast, China raises 12.5% of its GDP in tax revenues while having the highest GST of only 13%. Vietnam has the highest GST of 8% and raises 11.4% of its GDP in tax revenues. Indonesia collects 11.9% of its GDP in tax revenues with the highest GST rate of 11%. An African country, Botswana, raises 34% of its GDP in tax revenues with the highest GST rate of 14%. The figure suggests that India does poorly on tax efficiency and is an outlier with the highest GST rate and low tax revenues. India imposes the highest tax in the world on its domestic sectors that account for a quarter of the Indian GDP and employs 17% of India’s workforce. These critical sectors are automobiles, construction (cement is taxed at 31.36%), electronic items such as air conditioners and refrigerators, luxury hotels, etc. These sectors cumulatively generate employment for over 100 million people. The high tax policy has jeopardized the livelihood of people in these sectors. India also has one of the highest marginal income tax rates in the world. Most European countries with high-income taxes have low inflation compared to India. Inflation reduces the purchasing power of nominal income. In an era of stagnant incomes, the real income tax is substantially higher than the general perception. It is an economic fallacy that increasing the tax rates leads to higher tax revenues.  On the contrary, there is theoretical and empirical evidence that high rates can lead to lower revenues. This is because of several reasons. First, high tax rates reduce economic activity. High tax rates lead to lower sales, a fall in production, and a decline in employment. As the economic activity comes down, tax revenues come down. For example, the cumulative tax on cars is more than 40%. The Federation of Automobile Dealers Association has raised the alarm that there is an inventory of 8 lakh unsold cars worth Rs.78,000 crore. Even the two-wheelers purchased by the price-sensitive middle class attract a tax of 28%. All the auto firms are struggling because the high tax policy has deterred people from buying automobiles. The policy also threatens the livelihood of 37 million people employed in the sector. Second, high tax rates encourage smuggling and black markets. For example, the government levies a 53% tax on cigarettes to curb smoking and generate tax revenues. However, ITC Ltd. recently estimated a potential tax revenue loss of 21,000 crore rupees because of smuggled cigarettes. This policy also hurts Indian tobacco farmers because tobacco in the smuggled cigarettes is grown abroad. Excessive tax rates on cigarettes can also be a health hazard as they force people to switch to unregulated and unbranded products. A sharp increase in the Securities Transaction Tax (STT), Short-term Capital Gains Tax (SCGT), and Long-term Capital Gains Tax (LCGT) has led to dabba trading or trading outside the legally recognized stock exchanges. Informal estimates suggest that the volume of trading in informal exchanges is almost 25% of formal exchanges. The STT was introduced in 2004 as an alternative to LCGT. However, when the government introduced the LCGT in 2018, it did not scrap the STT. To rub salt in the wounds, it increased the STT by almost 60% in 2024. Even the SCGT and LCGT increased by 33% and 25% respectively. Third, a high tax policy penalizes honest taxpayers and encourages under-reporting of income and profits. Thousands of clean millionaires who could have contributed to the wealth generation have left India with their wealth. The only beneficiary of high tax rates is the tax bureaucracy. This is because high tax rates incentivize the industry to offer bribes to tax inspectors. Hence, it was an institutional oversight that the GST’s rate-fixing committee has been left completely to the bureaucrats with no political representation. Bureaucracy has no accountability and benefits from increasing tax rates. The Union Finance Minister has suggested that the average GST rate is only 11.6%. However, a more appropriate measure would be an average GST rate weighted by the relative importance of a good in the overall GDP.   Since the government does not disseminate the GST data to compute the average weighted GST rate, these claims are unverified. It is a fact that high tax rates hurt the economy. Nevertheless, to raise tax revenues, the government has raised tax rates to the point where India has the highest tax rates worldwide. As a consequence, India’s GDP growth has crashed. Experts suggest a structural slowdown and low growth rates in the coming several quarters. India needs to increase its tax rate efficiency, not its tax rates. However, the former is conditional on a broader economic reform agenda. The knee-jerk reaction to raise tax rates will only hurt the economy and destroy long-term tax revenue generation. In India, the government is growing at the expense of its people. While the economic growth is slowing down, the pace of tax collections is increasing. It may be desirable to increase the tax revenues, but it should not jeopardize the people’s long-term progress. The author has a PhD in Economics from Clemson University, USA. He is currently an Associate Professor of Economics at RV University, Bengaluru. The Author is a Honourary Research Fellow at AgaPuram Policy Research Centre.  Views expressed by the author are personal and need not reflect or represent the views of the AgaPuram Policy Research Centre. This article was originally first published by The Economic Times https://m.economictimes.com/opinion/et-commentary/indias-high-tax-rates-boon-for-bureaucrats-bane-for-the-economy/amp_articleshow/118609436.cms

High Tax Rates Do Not Translate into Higher Tax Revenues Read More »

Status of Finance Health of Urban Local Bodies in Odisha

Status of Finance Health of Urban Local Bodies in Odisha Status of Finance Health of Urban Local Bodies in Odisha Dushyant Meher February 22, 2025 Indian Economy, Public Policy, Urban Development Fiscal Excellence of Odisha Financial health is the key indicator of capability, opportunities and challenges of an individual, family, institution or a government. Urban Local Bodies (ULB) like city corporations, municipalities and town panchayats are belong to the third tier of our governance structure responsible for urban growth centres that plays a crucial role in the era of aspirational India. The third tier of governance was enforced through 73rd and 74th Amendments Act in 1993 – an early stage of our economic reforms gradually becoming part of policy discourse because of its mandate and functions entrusted upon. On the backdrop of the latest report on “Fiscal Health Index 2023” to assess the fiscal health of the States; it is also a matter of imperative to look at the   state of municipal finances as reported by Reserve Bank of India in its “Report on Municipal Finances 2024”. This report delineates the sources of revenue generation, opportunities and challenges by the municipal corporations of the states. In the context of “Odisha” that stood on top of the list of States in India due to its fiscal prudence obtained through a systematic financial management over a period of time as per “Fiscal Health Index 2023” by NITI AAYOG; an analysis of the financial health of MC may help further strengthening the overall financial wellbeing of the State through its municipal governance. There are 5 MCs in Odisha namely- Berhampur, Bhubaneswar, Cuttack, Sambalpur and Rourkela situated in eastern, western and northern region of the state. As per 2011 Census, Odisha was one of the least urbanized states in India, however, it is catching up in urbanisation as in 2024; 34 new notified area councils (NCCs) and upgradation of 5 municipalities added to the list of local urban governments. The NITI AAYOG Report on Fiscal Health Index 2023 highlighted that “Odisha excels in fiscal health with the highest overall index score of 67.8. It tops the Debt Index (99.0) and Debt Sustainability (64.0) rankings with better than average scores under Quality of Expenditure and Revenue Mobilization. The state has maintained low Fiscal Deficits, a good debt profile, and an above average Capital Outlay/GSDP ratio.” Also “the top five high-performing states are Odisha, Chhattisgarh, Goa, Jharkhand, and Gujarat.” Further, the report stated that “Odisha and Chhattisgarh have performed well under Revenue Mobilization, with their Own Non-Tax Revenue growing significantly due to high revenue collection from mining.” The Reserve bank of India, started focusing on the financial health of MCs by releasing state-wise reports in 2022 and 2024 that delve into fiscal position. Since, MCs are responsible for the provision of vital public services like health, education, water, sanitation, street lighting, public parks registration of births and deaths under their jurisdictions; they have a crucial role to play in effective urban management, urban development and upgradation of urban infrastructure. Odisha is also mineral rich state which supports for manufacturing sector across different region. Odisha publishes monthly fiscal report. According to RBI report “Odisha was one of the most fiscally stressed States in the early 2000s, with a debt-GSDP ratio of 57.3% in 2002-03 – well above the consolidated debt-GDP ratio of 32.1% for all States. The interest payments to revenue receipts ratio (IP/RR) was 34.2% in 2002-03, imposing a significant strain on the State’s finances. Over the subsequent two decades, there has been a turnaround in the fiscal position of the State, with the debt-GSDP ratio declining to 16.0% in 2023-24 –the lowest among the Indian States”. RBI Report also highlights that “during the challenging times of COVID-19, Odisha maintained prudent fiscal practices like periodic revision of the rates/user charges of various tax and non-tax sources and monthly reviews of revenue collection. Odisha is the only State to register a revenue surplus (1.7% of GSDP) during the pandemic year of 2020-21, which increased to 6.5% of GSDP in 2021-22 on account of higher realisation of non-tax revenue.” Status of MCs in Odisha The RBI report primarily highlights the revenue account, revenue sources and reforms being undertaken by MCs. In the context of Odisha – the following observations convey the status of its MCs: The size of revenue receipts of MCs in Odisha has increased substantially in last five years period from Rs.612.36 crore in 2019-20 to Rs.1266.96 Crore in 2023-24 (BE). Total revenue expenditure of 2023-24 (BE) is Rs.1060.89 crore. Ratio of Municipal Corporations’ Revenue Receipts to State Government’s Revenue Receipts comes to 0.7 Ratio of Municipal Corporations’ Tax and Non-Tax Revenue to State Government’s Tax and Non-Tax Revenue is 0.3. The percentage of Revenue Grants, Contribution and Subsidies has marked an increase by 21.6% which doubled from 22.27% in 2019-20 to 43.87 in 2023-24 (BE). In terms of capital receipts; there is a marked increase in Finance Commission grant from 6.17 % out of total receipts for specific purposes in 2019-20 to 21.28 % in 2023-24 (BE). Similarly, the State Finance Commission grant increased by 10.26% from 21.17 % to 31.43 % for specific purposes. Capital expenditure of the MCs in Odisha has been consistently above 95% throughout in last five years under evaluation. The ratio of capital expenditure to total expenditure for MCs is more than 50%. The own tax ratio of MCs in Odisha was only 14.98 % in 2023-24 (BE) as compared to the highest level at 53.8% in Karnataka and 50.3% in Telangana. A trend of decreasing in percentage of own tax revenue (OTR) was observed in last three years from 22.86 % in 2021-22 to 16.00 % in 2022-23 and a further decrease to 14.98 % in 2023-24 (BE). Similarly, sources like- “income from investment” and “interest earned on loans” have reported a decrease from 4.13 % in 2019-20 to 1.72 % in 2023-24 (BE) and from 4.08 % to 1.45 % respectively. RBI Report Highlighted the following Institutional

Status of Finance Health of Urban Local Bodies in Odisha Read More »

Deregulation Begins at Home

Deregulation Begins at Home Deregulation Begins at Home Shanmuganathan Nagasundaram February 21, 2025 Economic Reforms, Indian Economy, Indian Liberals CEA Dr. Anantha Nageswaran eloquently distinguished between digitization and deregulation, emphasizing that digitization does not necessarily imply deregulation Our Chief Economic Advisor (CEA), Dr.Anantha Nageswaran, has made a dispassionate plea for Deregulation. He was eloquent enough to distinguish between digitization and deregulation, indicating that the former need not imply the latter. The memo to bureaucrats- Eliminate, Not Automate. Kudos indeed. If I were to add something specific on this front, it would reinforce the urgency and importance of Deregulation. The poster boy of “Free Market Economics,” Javier Milei, did not set up a committee to study Deregulation but just started on day 1 with a “Department of Deregulation”. It’s been just about a year that Milei has been in office, and they have eliminated, on average, about 5 regulations/day—and Argentina started with far fewer regulations than India has. Milei is not even a career politician. He is an Economics Professor turned President who overcame the formal collegial indoctrination on Economics by reading Rothbard and Mises. The world indeed has a role model and a roadmap to adopt. This article is about the most important Deregulation that our CEA has entirely skipped. In fact, on this aspect, we are doing the exact opposite of Deregulation and no matter what happens in all other departments/functions of the Government, unless this is fixed, nothing else will matter. I am, of course, talking about the elephant in the room, i.e. the fiscal deficit or the Deregulation equivalent in this case of running “balanced budgets”. The distortions and malinvestments caused by our deficit spending for decades (practically since 1947) has kept Indians poor. Forget Austrian Economics; even if one studies history, it will be very easy to observe that no nation has ever managed to become prosperous by continually debasing the currency. It is indeed very amusing (if not for the tragic consequences) to see a deficit-to-GDP ratio of 4%+ described as “fiscal consolidation” by economists and supposedly independent market observers. If this is the definition of consolidation, I shudder to think what expansion would look like. What is Deregulation about? Deregulation refers to removing or reducing government controls on a country’s economic functioning. It is based on the fundamental premise that market regulations offer the best protection to consumers. All transactions in the market occur ONLY because of a consensual agreement between two parties, and hence, there is no need for the Government to impose its wisdom on such issues. At a more generic level, I would look at Deregulation as the process of handing over economic control to the citizens and away from the hands of the bureaucrats and politicians.    It’s not that the markets are a utopia; it’s just that Government regulations worsen the situation. Let me take the example of a universally accepted regulation, “Minimum Wages,” and how it hurts the workers it is supposed to help. At the outset, Wages are the “price of labor”. In much the same way that we don’t want the government to determine the price of tomatoes and cars, we shouldn’t have the government determine the price of labour. The market forces of supply and demand determine wages. An employer has a choice from the labour pool of potential employees, and the employee chooses from the pool of potential employers. A “Free Market” is a voluntary transaction between two consenting parties. Nobody is forcing—neither does the employee have to work below what he thinks is his correct wage, nor does the employer have to overpay compared to what is available in the open market for that particular skill. Now, let us take the case where the “Minimum Wage” is kept above what the market would pay for that activity. Just to make the case more realistic, we will use Cognizant’s Rs.20,000 per month (that’s less than $250/month at current exchange rates) salary offer to engineering graduates. Thankfully, no minimum wage laws apply to the software industry at this point, and so despite the expected uproar of comrades, there was little traction in the market for such protests. But let us suppose that the Indian Government stipulates that the software industry’s minimum wage should be Rs.30,000 per month. How would that affect engineering graduates? Would it not improve their lives? Firstly, let us put the market size in perspective and understand the limited role that Cognizant would have in affecting the outcomes of engineering graduates. The total worldwide employee count of Cognizant is about 3.5 lakhs, and perhaps the maximum they can recruit at the entry level would be about 10% of the workforce or about 35,000. The total number of engineering graduates produced annually in India is about 15,00,000 (15 lakhs). So even if the top 10 software companies in India colluded on this Rs.20,000 pm offer, the number of potential employees it would affect is less than 25% of the workforce. Realistically, it is likely to be less than 10%. The point is that no company is large enough to affect the outcome of the industry. So, if Cognizant is offering Rs.20,000, these are indeed the prices at which these individuals can be utilized to add value for their clients in a profitable manner. So, if the government had intervened to fix the minimum wage at a higher level, then most of these graduates would have remained unemployed. Instead of recruiting X number of people at a salary of Rs.20,000, Cognizant would have recruited only a fraction at Rs.30,000 per month. But the point is not the Rs.20,000 per month lost to those unemployed due to the wage restriction. An entry-level position’s most important value to an employee is the skills they acquire in the starting years, which provide upward mobility in the industry. With their restrictions, the Government unintentionally ensures the lack of skills development that would permit a higher market wage in the future. I have used the software industry as

Deregulation Begins at Home Read More »

Fiscal Prudence of Southern States

Fiscal Prudence of Southern States Fiscal Prudence of Southern States Madhusudhanan S February 19, 2025 Economic Reforms, Indian Economy, Tamilnadu Economy Among the Southern States, Karnataka leads and Tamil Nadu lags in fiscal prudence. Telangana shows strong improvement, while Andhra Pradesh remains almost stagnant. Kerala has improved its fiscal position, but still not healthy. Introduction The NITI Aayog published its report on fiscal status titled “Fiscal Health Index (FHI) 2025,” which was released on January 25, 2025. This report assesses the following five essential sub-indices that are combined to create the Fiscal Health Index: 1. Quality of Expenditure, 2. Revenue Mobilisation, 3. Fiscal Prudence, 4. Debt Index, and 5. Debt Sustainability The fiscal health of 18 major states receives a thorough assessment in the report, which provides insights into the unique challenges and potential improvements in each state. In this article, we will focus exclusively on the fiscal prudence of 5 Southern States. 1. Andhra Pradesh The report states that Andhra Pradesh has always been in fiscal and revenue deficit for the past five years. The Fiscal Deficit to GSDP ratio in 2022–2023 was 4%, falling within the target of 4.5%. The State allocates only about 10% of the total developmental expenditure to capital expenditure. The State amends the Fiscal Responsibility and Budget Management Act (FRBM), from time to time and it is required to achieve specified fiscal targets within the specified periods.  The report suggests that Andhra Pradesh “may focus on enhancing capital expenditure efficiency, optimize committed spending, diversifying revenue sources for greater resilience, and may enforce strict fiscal discipline.” Andhra Pradesh’s rank has come down from 16th position to 17th in 2022-23. It faces high fiscal deficits and lags in the quality of expenditure and revenue mobilisation. The state needs to increase its resource mobilisation and improve its quality of expenditure, while adhering to the FRBM target. 2.Karnataka The report notes that with a revenue surplus of 0.6% in 2022–2023, the State has met its target. Against the 3.5% target set by the FRBM Act, the fiscal deficit was much lower at 2.1%. Further, compared to the previous year (i.e. 2021-22), the Fiscal Deficit to GSDP also declined from 4.1% to 2.1%, due to revenue surplus. While 2022-23 saw a decrease in the quality of expenditure from 54.5% (the 2014-15 to 2018-19 average) to 47.4%, the fiscal prudence score increased from 31.1% to 43.9%. The report suggested that the State may “focus on reallocating expenditure toward education and health. It may need to focus on increasing the revenues of the state.” Karnataka leads the Southern States in fiscal prudence. In 2022-23, the State has slipped from 3rd rank to 10th rank, though it is the best of the southern States, indicating an unfavorable fiscal situation of all the Southern States.  Except for revenue mobilization, Karnataka excelled across all parameters of the Fiscal Health Index. To better its position, Karnataka needs to review its expenditure pattern and increase its revenue mobilisation.  3.Kerala In 2022–2023, the revenue deficit declined to 0.9% of GSDP from 3.3% in 2021–2022. As a result of the decline in the revenue deficit, Kerala’s fiscal deficit also showed a downward trend. In terms of GSDP, the fiscal deficit declined from 5% in 2021–2022 to 2.5% in 2022–2023. The States’ reliance on non-tax revenue is affecting its fiscal stability. While observing that “the fiscal responsibility targets mandated by the Kerala Fiscal Responsibility (Amendment) Act, 2022, aim for the elimination of Revenue Deficits by 2025-26, with specific annual Revenue Surplus goals” the report suggests that the State “may focus on enhancing revenue mobilization through effective tax and Non-Tax strategies, optimizing resource efficiency, increasing Capital Expenditure in the Social Services Sector are increased, and rationalizing expenditures to improve its fiscal health.” Kerala has continuously encountered fiscal challenges for the past nine years. The State is lagging much behind in terms of quality of expenditure and debt sustainability. It is also burdened with substantial interest payments, inefficient capital expenditure and limited resource mobilisation. The State has to improve in terms of quality of expenditure, and find out new sources for resource mobilisation. It should also aim to curtail its debt and interest payments, which are already eating up major sources of income for the state. 4.Tamil Nadu From 2018–19 to 2022–23, the fiscal deficit as a percentage of GSDP increased from 2.9% to 3.4%. Since 2013–14, the revenue deficit has been increasing, with the State’s Own Tax Revenue to GSDP remaining stationary at 6% in the last 5 years. Though the State aimed to eliminate revenue deficit by 2021-22, it decreased only by around 22.2% in 2022-23 over the previous year. The State has set targets to maintain the ratio of total outstanding debt to GSDP at specific levels under the Tamil Nadu Fiscal Responsibility Act, 2003. However, it has exceeded these limits and witnessed an average ratio of 29% over the past 3 years. The report noted that Tamil Nadu “has witnessed significant growth in revenue and capital expenditure, with fiscal deficits and debt levels exceeding the FRBM target.” Tamil Nadu lags in fiscal prudence and needs to reduce its existing liabilities and non-essential spending. The State should strive to keep its fiscal deficit within the limits set by the FRBM Act, without any relaxation. It should also improve the quality of expenditure and need to look for more investments for development. 5.Telangana Although the state’s fiscal deficit target was set at 5% of GSDP, it managed to reduce the deficit to 2.48% in 2022–2023. The State achieved revenue surplus “after three years of deficits and remained compliant with the FRBM targets for both fiscal and revenue deficits in 2022-23.” The report observes that Telangana’s revenue growth is strong and encouraging and suggests that it spends more on increasing Capital Expenditure, especially in the health and education sectors. Telangana has maintained a healthy fiscal positions, due to an effective tax collection system, balanced approach to expenditure and resource mobilisation efforts. It tops in resource mobilisation for all periods.

Fiscal Prudence of Southern States Read More »