
State Economies

India’s MSMEs Problem Is Not Credit, It’s Cash Flow!

India’s MSMEs Problem Is Not Credit, It’s Cash Flow! India’s MSMEs Problem Is Not Credit, It’s Cash Flow! Sivakumar Chockalingam August 29, 2026 Indian Economy, Public Policy, State Economies, Youth Entrepreneurship Why MSMEs reforms matter — and why TReDS could be the missing link between sales and liquidity? India’s MSME challenge is often described as a credit-access problem. Increasingly, it should be understood as a cash-flow architecture problem. Credit can finance growth. Small businesses often lack collateral, have limited financial histories and face higher borrowing costs. But a more fundamental problem is receiving payment for work already completed. For many micro and small enterprises, the most important source of working capital is not another loan. It is the timely realisation of their receivables. The scale of the problem is significant. The Economic Survey 2025-26 estimates that around Rs.8.1 lakh crore are locked in delayed payments to MSMEs. The Survey notes that delayed payments particularly affect micro-suppliers, constraining liquidity and growth. It also identifies the expansion of TReDS (Trade Receivables Discounting System) and digital invoicing as important interventions in addressing the problem. TReDs /Domestic Trade Exchanges system are regulated by RBI through the Receivables Exchange of India Ltd. A small supplier may hesitate to pursue a delayed-payment claim against a major customer because the customer may also be its most important source of future business. The Economic Survey explicitly recognises this tension: MSMEs may fear damaging commercial relationships by taking formal legal action. This is one reason why faster, lower-cost and less adversarial dispute resolution matters. Further, the Union Ministry of MSME’s Annual Report-2025-26 provides another indication of the enforcement gap. As on 31 December 2025, 2,56,892 applications had been filed on the MSME Samadhaan Portal, involving Rs.55,244.31 crore. Of these, 53,911 cases had been disposed of by MSEFCs, involving Rs.14,638.38 crore. At the same time, 52,744 applications involving Rs.8,397.25 crore were still awaiting review. These figures do not capture the entire universe of delayed payments — the Economic Survey’s Rs.8.1 lakh crore estimate is much broader — but they demonstrate how difficult it can be for an MSME to convert a payment claim into actual cash. The issue is not merely financial. It is behavioural. This is why the delayed-payment provisions and the growing role of the Trade Receivables Discounting System (TReDS) deserve to be viewed together. The Micro, Small and Medium Enterprises Development (Amendment) Bill, 2026, passed by Parliament on 7 August 2026, could represent a meaningful shift from simply expanding credit to strengthening the cash-flow architecture around MSMEs. The latest amendment attempts to strengthen the systemic issues. It provides for Online Dispute Resolution, introduces timelines for mediation and arbitration, and strengthens enforcement of mediated settlements and arbitral awards. If an application to set aside an award remains pending for more than six months, courts are mandated to order payment of at least 50% of the awarded amount to the micro or small enterprise supplier. Awards and mediated settlements can also be recovered as arrears of land revenue through the appropriate authority. These provisions matter because a legal entitlement has limited economic value if the enterprise cannot survive long enough to realise it. But enforcement after a payment default should be the second line of defence. The more important policy objective should be to make delayed payments less damaging in the first place. This is where TReDS becomes strategically important: TReDS effectively allows an eligible MSME receivable to become a source of liquidity before the buyer’s contractual payment date. An invoice accepted by the buyer can be discounted through an RBI-regulated platform, with financiers competing to fund the receivable. The MSME receives cash earlier while the buyer continues according to the agreed payment cycle. The scale-up has been striking. According to the Ministry of MSME, invoice discounting on TReDS has increased from about Rs.40,000 crore in 2022-23 to Rs.3.47 lakh crore in 2025-26. In July 2026, the Union government also notified that all operating Central Public Sector Enterprises must route settlement of invoices for goods and services procured from MSMEs through TReDS platforms. TReDS system can turn verified receivables into liquidity. Credit institutions can increasingly use such data to understand the underlying quality of a business. The next logical step is to connect these pieces into a coherent MSME cash-flow ecosystem. For policymakers, therefore, the question should not be simply how much additional credit can be made available to MSMEs. It should also be: how much of the MSME’s existing economic value is trapped because payment does not arrive on time? A business that has already delivered Rs.1 crore of goods or services does not necessarily need another Rs.1 crore loan. It may need its Rs.1 crore receivable to become liquid. That distinction is important because borrowing to compensate for delayed payments can increase leverage and financial costs. If receivables can instead be financed competitively and transparently, the enterprise can maintain production, pay employees and suppliers accept new orders and grow without repeatedly refinancing the same working-capital gap. Yet TReDS system should not become an excuse for buyers to routinely extend payment cycles. Invoice discounting solves the liquidity problem; it does not fully solve the underlying payment-discipline problem. It is also not mandatory for private sector vendors. The policy objective should therefore have two layers. First, make timely payment the norm through stronger disclosure, enforcement and institutional accountability. Second, provide efficient receivables financing when payment cycles create unavoidable working-capital gaps. This is particularly relevant for states such as Tamil Nadu, where millions of MSMEs (are deeply embedded in industrial supply chains — from engineering and auto components to textiles, food processing and a wide range of services, etc. The effectiveness of the national reforms will ultimately depend on adoption at the state and cluster level, including awareness among smaller enterprises and participation by buyers, banks and financiers. Therefore, the 2026 MSMEs reforms are therefore important not simply because they amend a 20-year-old law. They bring together three pieces of a larger policy puzzle: faster dispute resolution, stronger recovery

India’s MSMEs Problem Is Not Credit, It’s Cash Flow! Read More »

The Paradigm Shift of Tamil Nadu Politics and New Government’s First Budget-2026-27

The Paradigm Shift of Tamil Nadu Politics and New Government’s First Budget-2026-27 The Paradigm Shift of Tamil Nadu Politics and New Government’s First Budget-2026-27 Chandrasekaran Balakrishnan August 12, 2026 Public Policy, State Economies, Tamilnadu Economy For a long time, the regional politics of Tamil Nadu has been closely watched at the national level. Ever since the regional party was first elected as the ruling government, defeating a national party, the furious State’s identity politics became a focal point with emphasis on the Tamil language, federalism, State autonomy, perpetual campaign against other Indian languages, miscommunication of the relationship between the Union Government and the State Government, nationalist spirits, etc. Besides the antiquity of cultural value systems embedded in the land and Tamil people, what are closely watched at the national level are the achievements of the state’s welfare progress, social development and economic development indicators. It is interesting to note that there is a new narrative by the newly elected state government led by Tamilaga Vettri Kazhagam (TVK), after close to six decades of two party rulings which made the governance systems redundant at all levels for a long time. However, it’s not entirely a new narrative as such; regional politics are concerns; it is a new flavour in an old bottle with few exceptions. The newly elected State Government led by TVK, under the Chief Ministership of Shri. C. Joseph Vijay, in Tamil Nadu, has brought out three important process reform steps that are worth noting. These include (i) Release of White Paper on Status of State Finance, (ii) White Paper on Status of Electricity Department/Energy Sector, and (iii) Constitution of a High Level Committee on “Revenue Augmentation” under the chairmanship of eminent economist Shri Montek Singh Ahluwalia. As far as the white paper on the status of state finance is concerned, the release of the white paper, which spells out the increase of the state’s debt (Rs.10.98 lakh crore) in a short span of time, is really shocking. It notes that the rise in debt for servicing the loans already availed and channelling to expenditures which are not creating durable assets in the state economy are real concerns. It also rightly focuses on undertaking reforms in some of the state public sector companies, which are welcome. Similarly, the white paper on TNEB are very important steps towards process reforms in state’s energy sector which is irrecoverably riddled with debts of Rs.2.47 lakh crore, redundancy in financial management, contracts awarded to vested interests groups, failure to build adequate infrastructure for power supply which is main lubricant to the dynamic economic activities, etc., and these are some of the structural and institutional irregularities plugging the state’s energy sector for quite long time. The TVK Government has presented its first budget for the year 2026-27. TVK has got a thumping victory in the assembly elections of 2026 with historic shifts in state politics literally ending the two Dravidian party rulings. The budget spelled out its long-term goal of achieving a 1.5 trillion dollar economy by the year 2036. Further, the new government has adopted its election manifesto as the main guiding document for the next few years and states that “the Vetri Tamizhagam Vision Document, covering sectoral priorities which inter alia include empowering women, improving governance, providing housing for all, ensuring safe drinking water, generating sustainable livelihood opportunities, protecting social justice and promoting green cover. The first budget of this Government would lay the foundation for realising these visionary programmes.” The TVK government’s first budget-2026-27 is seems to be clearly well thought out to undertake the much needed process reforms in the state which were hitherto perpetually undermined by the successive governments. Interestingly, the Budget aims “to transform public service delivery and streamline administrative workflows, a Governance Processes Reforms Committee will be constituted under the chairmanship of Chief Secretary. Bringing together senior administrative leaders, industry transformation experts, and academic system designers, the Committee will re-engineer bureaucratic processes, eliminate redundant compliance, and build a modern, technology-enabled, citizen friendly (G2C) and business friendly (G2B) governance ecosystem in the State.” Taking the vision document into action, the new Government’s first budget focuses mainly on the sectors of revenue augmentation, reforming the energy sector, increased access to mobility, modernisation of government schools, etc. The streamlining of state fiscal health has been identified as a top priority, which aims to be fixed by the next two years are good steps. The budget focuses on clean campuses for school children, skilling of 1.2 million college students and one lakh unemployed youth on emerging sectors like AI, modern residential infrastructure for college students for one lakh beds capacity across 200 educational hubs, and aims to skill and empower 5 lakh youth across engineering colleges, polytechnics and ITIs by 2031. The efforts to address the issues of unemployment, unskilled youth and employability are a tall order and are need to be backed up with a strong institutionalised system partnering with industries are must be embedded in the programme implementations. Nevertheless, the following are some of the key announcements made in the budget that have strong implications for the growing economy: Multi Modal Logistics Parks (MMLPs) and Dry Ports at strategic locations, and to establish petrochemical and ancillary industries. A system for installing smart meters for all consumers in Chennai city, as well as for 50 lakh industrial and commercial consumers across other parts of the State. The ‘Chief Minister’s Integrated Urban Development Mission’, bringing under one roof urban infrastructure, water supply, underground sewerage systems, integrated solid waste management, city roads, urban transport, expansion of green spaces, protection of urban water bodies, social infrastructure, etc. TN 26-27 Budget: “‘Performance Based Maintenance Contract’. Members of the public may photograph and report any road defects through the ‘Namma Salai’ mobile application, and such defects will be rectified promptly.” All of the above budget announcements are interesting, but we need to wait and see the modality of each of these schemes’ implementation and outcomes achieved. One of the key to achieve greater outcomes

The Paradigm Shift of Tamil Nadu Politics and New Government’s First Budget-2026-27 Read More »

Tamil Nadu’s Unhealthy Growth Pose Threats

Tamil Nadu’s Unhealthy Growth Pose Threats Tamil Nadu’s Unhealthy Growth Pose Threats Baskar R March 26, 2026 Public Finance, State Economies, Tamilnadu Economy Introduction The fiscal position of Tamil Nadu has been under stress for a decade and more starting from 2015-16, the revenue deficit to GSDP ratio has started exceeding one per cent and fiscal deficit exceeded 3 per cent in 2016-17.  The State economic management post pandemic, not adapting to the prevailing national fiscal management policies were contributing to these deterioration. Having been the traditional leader among major Indian States in per capita own tax revenue being the 6th in position reflects, this.  The State ranks 18th in terms of revenue receipts to GSDP ratio and 10th in own tax-to-GSDP ratio (Shanmugam KR, Tamil Nadu State Govt Finances, April 2025). With this background, attempts have been made here to study some of the key indicators of Tamil Nadu Interim Budget 2026-27.  We have interesting insights on how Tamil Nadu State is faring against its peer states.  Data for Tamil Nadu has been updated based on the interim budget estimates (IBE) and for rest of the States retained as per 2025-26 Budget Estimates (BE). Fiscal Deficit: GFD-GSDP ratio for Tamil Nadu just about stays within the Centre’s prescribed ceiling at 3.48%. This is worse than the Budget estimate by 48 bps.  Revenue Deficit: For 2025-26 (RE) Revenue deficit of Tamil Nadu is at 1.9% of GSDP, 2026-27 budgeted at 1.2% and committed expenditure as % of revenue expenditure is high at 40.9%, at an increasing trend over last three years. Both indicators, highlight Tamil Nadu is faring behind its major peer States used for benchmarking.  Revenue growth is important to fund its growth and the pressures from handling committed expenditure on salaries, pensions and healthcare in an ageing demographic context is a serious problem. Outstanding Liabilities and Interest Payments Outstanding liabilities by State are typically available only as part of the RBI Study and isn’t part of respective State Budgets. The report for 2025-26 helps compare States’ performance uniformly. The key components of outstanding liabilities are State Development Loans, loans from institutions, UDAY, NSSF, loans from Centre, PF, Reserve Fund, deposits and advances, etc. Tamil Nadu is the only State which has crossed Rs.10 lakh crores of outstanding liabilities and has been on increasing trend in recent years. As % of GSDP it is at 29.2% higher than its peer States. Further, RBI Study compares interest payment of States against their revenue receipts to assess how much of State’s own revenue is consumed by debt servicing before any discretionary spending and against revenue expenditure to see how much of it is spent on interest as against services (education, health and salaries) on recurring activities. Comparing interest as % of GSDP would mask underlying revenue capacity constraints.   Expenditure Pattern – Development Expenditure Key Development Expenditure (DEV) pattern and Social Sector Expenditure (SSE) across the major States reflect a mixed pattern.  Uttar Pradesh and Telangana does predominantly well on key indicators under this metric.  Whereas, Tamil Nadu is consistently below peers and needs to revisit the quality of its spending. While Tamil Nadu budgeted Rs 59,562 crore for capital outlay in 2026-27—a 16% increase from previous year. However, the absolute allocation remains constrained relative to fiscal deficit size.   Conclusion This study has reviewed the financial health of Government of Tamil Nadu based on the interim budget of 2026-27. Specifically, it has analysed the overall trends in fiscal deficit, revenue deficit, outstanding liabilities, interest burden, revenue expenditure and their compositions of development and social sector expenditure as % of GSDP. It also compares the capital expenditure pattern of Tamil Nadu with those of the other major State governments in India. A recent report on FISCAL HEALTH INDEX by Niti Aayog (2026) reveals that Tamil Nadu is ranked 13th as compared to Gujarat and Maharashtra ranked at 4th and 5th respectively. As is evident from the data above, Tamil Nadu’s financial performance faces multiple challenges, including rising debt, elevated revenue and fiscal deficit, higher interest burden, committed expenditure increasing to an all-time high of 41% of overall revenue expenditure, etc. This directly leads to lower development and social sector spending. While the State’s economy has grown at a commendable pace on year on year basis, the overall fiscal position has weakened with an increasing reliance on debt to finance revenue expenditures. The State must prioritise fiscal discipline through improved revenue generation, enhanced non tax revenues, and stringent control over debt and interest payments. The Author is a Finance Professional and has keen interest in current affairs and Indian culture. Views expressed by the author are personal and need not reflect or represent the views of the AgaPuram Policy Research Centre.

Tamil Nadu’s Unhealthy Growth Pose Threats Read More »

India’s Institutions and Its Bottlenecks: National Clean Air Programme

India’s Institutions and Its Bottlenecks India’s Institutions and Its Bottlenecks Prayaga Venkata Rama Vinayak March 19, 2026 Indian Economy, State Economies, Urban Development This article discusses about one of the most pressing environmental challenges faced by Indian cities – Air Pollution. Also, this piece talk about the sources of the air pollution analysing the latest available data along with the policy assessment of National Clean air program (NCAP) which aim to improve the air quality of selected 131 Indian cities. According to the 2021 Air Quality Guidelines of WHO, PM 2.5, PM 10, Nitrogen dioxide (NO2), Sulphur dioxide (SO2) and Carbon dioxide (CO2) are the major pollutant which influences the air quality in a particular city. Of these, PM 10 & PM 2.5 are the most dangerous pollutants. PM 10 is nothing but particulate matter with diameter near to 10 micro meters. A normal human hair usually has a width of 70 micrometers. These PM 10 particles are 7 times smaller than human hair. These PM 10 particles deposit in lungs and create many respiratory problems like breathing problems, lung irritation, chronic bronchitis etc. According to the WHO’s 2021 Air quality guidelines Road dust, construction dust, cement dust, smoke particles and Industrial dust are the significant sources for these PM 10 particles in the air. WHO air quality guidelines document also highlighted that PM 2.5 is even more dangerous than PM 10. PM 2.5 particles are Particulate matter in the air with diameter less than 2.5 micro meters which means 30 times smaller than the average human hair. Diesel vehicle’s exhaust, Coal power plants, Industrial combustion, Biomass burning (kind of stubble burning), household cooking fuels etc. are the sources of PM 2.5 particles in air. This leads to Lung diseases, Heart attacks, lung cancer and other deadly diseases. For thoroughly monitoring the pollutant levels the Central Pollution Control Board (CPCB) launched NAAQS (National ambient air quality standards) in 1982 and we are following the latest revisions of 2009 in which PM 2.5 was also included as one of the major pollutants. In 2014, the present NDA Government had launched NAQI (National Air Quality Index) which will give consolidated score of 8 pollutants which includes PM 10 and PM 2.5 along with other 6 pollutants responsible for air pollution. National Clean Air Programme (NCAP) has been launched by the Union Ministry of Environment, Forest and Climate Change as a comprehensive initiative in partnership with various Ministries and States to improve air quality at city, regional and national level. It is a focused and time bound scheme to implement various sectoral policies, strengthen monitoring and enhance public participation in 130 cities for effective air quality management. As part of this NCAP all 130 cities should come up with Graded Response Action Plan (GRAP) which is an emergency pollution control framework required implementing in all cities that activates progressively stricter measures when the Air Quality Index crosses specified pollution thresholds. This GRAP will be supervised by the Commission of Air quality management. Along with this, the States and cities are also required to come up with their City Air Action Plans which are city specific long term sstrategies designed to identify major pollution sources and implement targeted measures to reduce air pollution and improve urban air quality. Also, all these cities are required to create Public Grievance Redressal systems which will address the citizen grievances related to the air pollution. As per the Indian Government’s PRANA (Portal for Regulation of Air-Pollution in Non-Attainment cities) website, all 130 cities comply 100% with GRAP, City Air Action Plans (CAAP) and Public Grievance Redressal systems. As per PIB Report on 25th July 2024, 95 cities out of 131 cities have shown improvement in air quality in terms of annual PM10 concentrations in FY 2023-24 with respect to the baseline of FY 2017-18. 18 cities have met National Ambient Air Quality Standards (NAAQS) for PM10 (60 µg/m3) in FY 2023-24. Under NCAP, Rs.2408.19 Crores have been cumulatively released to non-attainment cities from FY 2019-20 till date. In addition, since the financial year 2020–21, the government has provided Rs.11,457.34 crores in grants to 42 large urban cities with populations over one million under the 15th Finance Commission. Further, the City Action Plan (CAPs) of 130 cities is implemented by coordinated action of state government and its agencies at state and city level. The funding for implementation of CAPs is also being mobilized through convergence of resources from various schemes of Central Government such as SBM (Urban), AMRUT (Atal Mission for Rejuvenation and Urban Transformation), Smart City Mission, SATAT (Sustainable Alternative Towards Affordable Transportation), PM E-Drive (Prime Minister Electric Drive Revolution in Innovative Vehicle Enhancement), etc. and resources from State/UT Governments and its agencies such as Municipal Corporation, Urban Development authorities and Industrial development authorities etc. The funding from NCAP/XV-FC is a performance based supplemental grant for funding the unfunded critical gap of CAP. So, can we conclude that NCAP served the purpose? The answer is partially yes. But there is still a room for improvement. NCAP was launched in 2019 aimed to reduce PM 10 levels by 20-30% when compared to 2017 levels by 2024. Many cities could not achieve that as air pollution is a very complex program and most of the cities were not even considered air pollution as serious problem to be tackled before NCAP. So, the governments felt it is not pragmatic to get the desired results by that time and extended the deadline with revised targets to 2026. Target has been set to achieve reduction in PM10 level up to 40% by 2025-26 from the levels of 2019-20. These interim targets are in line with global experiences which highlight those city specific actions led to 35%–40% PM2.5 reduction in five years for cities, such as Beijing and Seoul, whereas cities, such as Santiago and Mexico City have shown 73% and 61% reduction in 22 to 25 years with regard to PM2.5 and PM10 concentrations, respectively. But, the first phase of NCAP has at least brought

India’s Institutions and Its Bottlenecks: National Clean Air Programme Read More »

Bihar’s Flip-Flop on Alcohol Policy

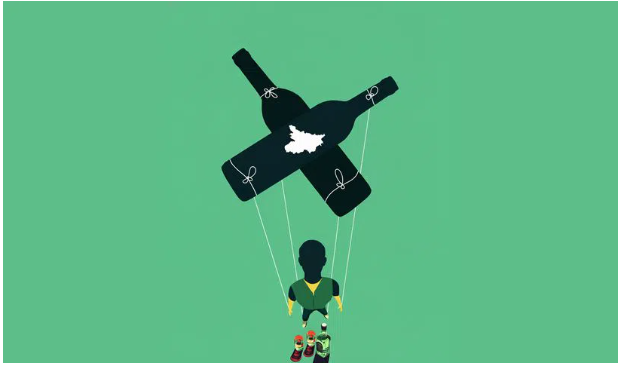
Bihar’s Flip-Flop on Alcohol Policy Bihar’s Flip-Flop on Alcohol Policy Ghanshyam Sharma December 12, 2025 Cultural Economics, Public Policy, State Economies Ironically, the poorest and most corrupt state first increased the number of alcohol addicts by promoting alcohol sales. Then, it arrested over 13 lakh men – for drinking alcohol. Over the past two decades, Bihar has conducted a uniquely absurd experiment in the history of alcohol regulation. Starting in 2006, it actively promoted the sale of alcohol to increase tax collections from alcohol sales. However, in 2016, it reversed course and introduced one of the strictest alcohol bans, which has had significant adverse effects on the people, corruption, and the economy. After the 2005 elections, the Bihar government pursued a policy to open a theka (or liquor shop) in every panchayat. Media reports noted that the number of liquor shops in rural areas tripled, from 779 to 2,360. As a result, tax revenues from alcohol jumped from Rs 87 crore to Rs 3142 crores in 2014-15. This represented 15 percent of the state’s budget. The new thekas increased the proximity to liquor. As a result, the number of men with alcohol addiction increased by 50 percent (NFHS-3 and 4). People develop an addiction to alcohol due to physical or emotional dependence on alcohol. For example, manual labourers drink alcohol to deal with chronic pain, especially in the absence of reliable and accessible healthcare.  Similarly, people who have been exposed to childhood adversity or are dealing with mental health issues are more likely to turn to alcohol for relief. When access to alcohol improves, such people are likely to increase their frequency and volume of alcohol intake. Thus, the policy exploited the vulnerable groups prone to alcohol addiction to raise tax revenue. However, despite the state government’s push to increase alcohol sales, the overall percentage of men in Bihar who drink alcohol actually declined in this period. The proportion of married women who reported that their husband drinks alcohol fell from 39 to 35 percent from 2006 to 2016 (National Family Health Survey-3 & 4). Hence, the alcohol taxes increased sales only because of an increase in demand from vulnerable groups who were prone to addiction. Hence, when Bihar imposed a comprehensive ban on alcohol in 2016, it came as a policy shock because the fraction of men who drink alcohol in Bihar was already declining (despite the government promoting alcohol). Besides, relative to other states, fewer men in Bihar were drinking alcohol. Several rigorous penal provisions of the prohibition law also came as a shock. For example, the provision of ‘guilty until proven innocent’ placed the burden of proof on the accused. According to the Transparency International Report (2019), Bihar is the most corrupt state in India. This law makes citisens vulnerable by vesting indiscriminate powers with the police to arrest people without proof. The law also punished drinking in a public place with life imprisonment. The law penalised possession of knowledge about alcohol with eight years of imprisonment. The law has had several predictable consequences. Since 2016, Bihar has arrested over 13 lakh people (mostly men) under the prohibition law, as only half a percent of women drink alcohol in Bihar (NFHS). The actual conviction rate in these cases is one percent (Indian Express report).  Kumar and Raghavan (2020) found that the SCs & STs faced disproportionate arrests under this law, and many have been awaiting trial for several years. Over 8 lakh prohibition-related cases have clogged the courts and overcrowded prisons. The prohibition has led to thousands of undocumented deaths from spurious alcohol. In April 2023, the Supreme Court raised concerns about the fairness of the law that makes drinking alcohol a non-bailable offence.  The Court also questioned whether the prohibition had been effective in curbing alcohol consumption.  In a study recently published in the journal Economics of Governance, I find that despite such rigorous provisions, there has been only a 6 percentage point decline among men who drink alcohol. I also find empirical evidence for bootlegging. Alcohol consumption has declined less in districts that share a border with other states or Nepal.  Selling alcohol in districts that do not share a border with other states would imply dealing with two police departments, which would increase the price and risk of selling alcohol in such districts. I find further evidence of bootlegging as there is a sharper decline in low alcohol (e.g, beer) drinkers compared to high alcohol spirits (e.g., whiskey). This is because high-alcohol spirits such as whiskey are easier to store and last longer compared to low-alcohol drinks, which may need cold storage. I also find evidence of a decline in branded alcohol drinkers, but no decline in spurious alcohol drinkers. This could be because branded alcohol is imported from outside the state, while spurious liquor can be sourced locally. Branded alcohol is relatively less harmful to drink than locally made liquor. Bootleggers use methanol to increase the potency of unbranded liquor, which can have severe health complications such as blindness or death. The alcohol ban has resulted in thousands of undocumented deaths from the consumption of spurious liquor. I also discovered that the prohibition has only deterred occasional drinkers – people whose frequency of alcohol consumption is less than weekly. The ban has not deterred people who drink daily. There is only a 1 to 2 percent decline in men who drink alcohol daily. This again highlights the wide availability of alcohol and the limitation of the policy. Governments globally have realised that educating people is more effective than bans. For example, the US government had to reverse its alcohol ban in the 1930s. Several US states have recently amended their “War on Drugs” policy and legalised their use. Prohibitions only lead to black markets, unfair arrests, targeting of vulnerable groups, an increase in corruption, loss of tax revenues, and the strengthening of criminal gangs/mafia. Bihar’s ban on alcohol has been a colossal policy failure. The ban is an attack on personal freedom.

Bihar’s Flip-Flop on Alcohol Policy Read More »

Karnataka’s Menstrual Leave Policy: Women Empowerment or Unintended Bias?

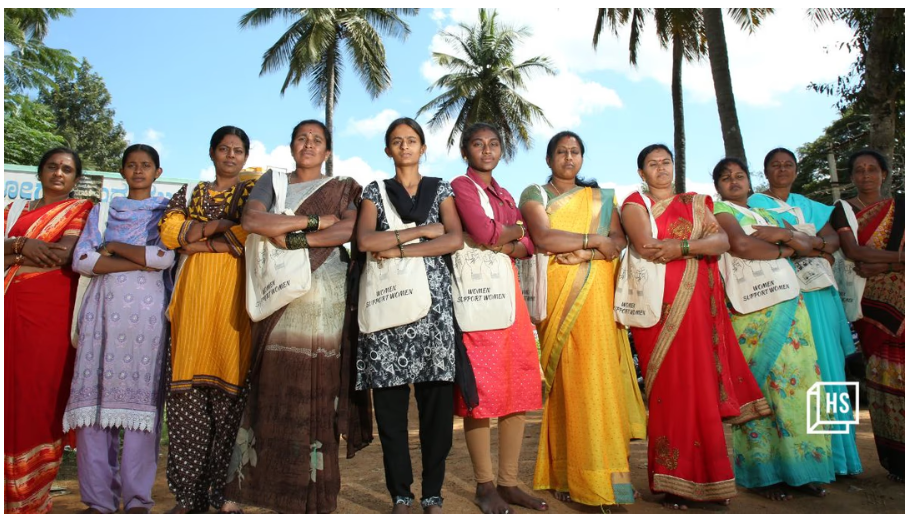
Karnataka’s Menstrual Leave Policy: Women Empowerment or Unintended Bias? Karnataka’s Menstrual Leave Policy: Women Empowerment or Unintended Bias? Prayaga Venkata Rama Vinayak November 14, 2025 Child Development, Cultural Economics, Public Policy, State Economies, Women Empowerment In a welcome move, the Government of Karnataka recently approved Menstrual Leave Policy, 2025, allowing female employees throughout the State to avail one day paid leave every month, in addition to other paid leaves sanctioned by their organisation. This policy applies to all women employees both in the public and private sectors across the State. Further, this leave does not require any pre-approvals from employers, but only prior intimation by the employees to their respective authorities. This move is worthy of emulation, as the State Government’s intention is to create a work environment that enhances women’s participation in the workforce. States such as Bihar, Kerala, and Odisha have implemented similar policies in the past. However, Karnataka’s policy explicitly covers both government and private sector employees, unlike those of the other States. Nevertheless, the initiative also warrants an analysis of its effectiveness in achieving the intended objective of women’s empowerment. One of the shortcomings of the policy is that it appears to apply only to employees in the organised sector, as no government currently has adequate mechanisms to implement such a policy in the unorganised sector, which employs a larger workforce. As of October 2025, Karnataka has approximately 10.96 million (1,09,61,042) unorganised sector workers registered on the e-Shram portal, of whom 58.1 percent (about 6.36 million) are women. However, many more women workers remain unregistered on the portal. Consequently, a majority of women employees in the State are unlikely to benefit from the policy. For micro, small, and medium enterprises (MSMEs), granting 12 additional paid leaves may lead to more absenteeism and payroll costs. From the women labour force point of view, the new leave policy may worsen the hiring bias, especially in micro and small firms that operate on very rigid workforce margins. Moreover, the state government has not proposed any reimbursement or tax offset to encourage small employers to implement the policy. The private sector may view women as costlier or less reliable employees due to additional leave entitlements like maternity, childcare and now menstrual leave. The “Voice of Women” Survey Report (2024) by Aon sheds light on how women employees view workplace equity and flexibility, which is pertinent while evaluating policies like menstrual leave. The survey mentions that findings reinforce years of research showing that women face microaggressions at work in the form of subtle and seemingly innocuous comments based on stereotypes. Nearly 42 percent women reported that they face judgmental comments or expressions on leaving work early or working remotely. Furthermore, one in three mothers reported facing career setbacks after returning from maternity leave — for 75 percent of them, the impact lasted up to two years, while 25 percent experienced setbacks lasting more than three years. We can understand from the above-mentioned survey that women are already going through lot of unavoidable discrimination in their workplace irrespective of many DEI (Diversity, Equity and inclusion) friendly policies. These kinds of policies will even amplify the ongoing discrimination to next level and, it’s worth noting that without awareness among the people in the work environment about female menstrual health and it’s impacts this kind of policies just pay a lip service to the concept of women empowerment. The periodic Labour Force Survey Report (2023-24) reveals that Karnataka’s Labour Force Participation Rate (LFPR), which indicates how many people are either working or looking to work out of the total population, is 49.9 percent for rural women, lower than the nation’s average of 51.2 percent. For urban women it is 33.5 percent, slightly above the nation’s average of 31.2 percent. The consolidated LFPR of women in Karnataka is 43.6 percent lower than the nation’s average of 45.2 percent. Further, Karnataka’s Worker Population Ratio (WPR), which indicates the proportion of working population, is 49.5 percent for rural women, a tad below the nation’s average of 50 percent. For urban women, it is 32 percent, considerably above than nation’s average of 28.8 percent. The consolidated WPR of women in Karnataka is 42.7 percent, slightly lower than the nation’s average of 43.7 percent. If the state government policy is implemented without addressing the recruitment bias faced by women in the private sector, especially in small firms, the already existing gap between the Karnataka’s LFPR and WPR of rural women will be widen, weakening the State’s efforts towards women empowerment. The policy may be modified to make it easier to implement. Instead of mandating complete paid leave, the governments can incentives organisations to grant remote work facilities for at least 3-4 consecutive days, wherever feasible. This will allow women to take proper care of their menstrual health. Also, the state government may consider this an opportune time to strictly enforce menstrual-friendly infrastructure in all workplaces with adequate hygienic and sanitation facilities across the public and private sectors. It would be commendable if the State Government could find convergence between schemes such as Koosina Mane, which empower local bodies and promote decentralization, and the implementation of new policies related to women’s menstrual health. Such an integrated approach would be mutually beneficial to both employees and employers. Further, it is essential to consult as many stakeholders as possible, including women, before implementation of the policy. The Karnataka State Menstrual leave policy is a welcome move, but it also brings some real concerns that may be overlooked. The matter requires a holistic understanding. It should aim to incentivise organisations instead of making them more hesitant to hire women, especially in smaller companies. The State Government should make sure the new policy supports both women and workplaces, without benefitting one at the cost of the other. Real inclusion means creating equal opportunities, not in offering special provisions that may inadvertently widen the very gap the policy seeks to close. The Author is Public Policy Fellow at AgaPuram Policy Research Centre, Erode The

Karnataka’s Menstrual Leave Policy: Women Empowerment or Unintended Bias? Read More »

Tamil Nadu’s bumpy road to $1-trillion economy

Tamil Nadu’s bumpy road to $1-trillion economy Tamil Nadu’s bumpy road to $1-trillion economy by Chandrasekaran Balakrishnan October 31, 2025 Public Policy, State Economies, Tamilnadu Economy Though Centre-state devolution gets public attention, little light is shed on intra-state devolution to rural and urban local bodies. If Tamil Nadu is to reach its goal of being a $1-trillion economy soon, the new State Finance Commission will have to address such issues The Tamil Nadu government accepted 259 out of 280 recommendations made by the sixth State Finance Commission without changing the ratio of devolution amount between rural and urban local bodies (Photo | Express) Updated on: 30 Oct 2025, 2:17 am 4 min read Tamil Nadu aspires to become a $1-trillion economy by 2030. However, it seems feasible only after 2031-32 given the amount of work needed on multiple fronts, ranging from effective decentralised governance and sectoral growth challenges to addressing intra-state regional disparities. While the state’s strength of being a global hub for manufacturing and its significant contribution to the services sector make the headlines, certain challenges remain under-discussed. Almost two years have passed since the release of a plan titled ‘Tamil Nadu Vision $1 trillion’, which aimed to “ensure that all districts and regions of the state emerge as growth centres, while driving prosperity for all sections of the society”. Yet, there has been a little visible change in implementing its key recommendations. In a dynamic federal country like India, state governments often tussle with the Centre seeking more regional autonomy. Ironically, some of the same states fare poorly in decentralisation of administrative power and financial autonomy within, despite a mandate for it under the 73rd and 74th constitutional amendments in 1992. The challenges faced by Tamil Nadu, especially its urban and rural local bodies, including its limited capacity to meet the aspirations of the people for better civic infrastructure facilities and services could be mostly attributed to inadequate institutional mechanisms. One of the biggest institutional and structural lacunae is that despite about 55 percent of people living in urban areas, the devolution of funds continues to be higher for rural local bodies (51 percent) as compared to urban local bodies (49 percent). Against this background, the state government has constituted its 7th State Finance Commission (SFC) under the chairmanship of K Allaudin, a retired IAS officer, to “review the financial position of various urban and rural local bodies and make appropriate recommendations on the distribution of funds to be provided by the state government” for a five-year period from April 1, 2027. This surpasses the target to become a $1-trillion economy by two years. The three-member commission has been asked to submit its report by August 31, 2026. Unlike states like Assam and Kerala, Tamil Nadu has not involved any subject experts on its SFC this time too, as has been the case since its inception in 1997. While the first, sixth and the recently-constituted seventh SFCs have been headed by retired IAS officers, others were headed by serving IAS officers. The key recommendations of the SFCs are mandated to be implemented within a year after the submission of action taken reports. However, there are no such publicly available reports on actual implementation until the next SFC is constituted. The state has accepted many of the past SFC proposals, ranging 80-96 percent of the recommendations. However, for the third SFC, the state government accepted only 240 out of the 308—or about 78 percent—of the recommendations. This gives a clue about how bound the state feels about acting on the proposals. The actions are important for the SFCs’ functions, which include a wider consultative process, examination of various data sets of rural and urban local bodies, and time taken to submit the report So it is instructive to look at the time taken by each SFC to make their final submissions. The state’s first SFC took 19 months, second 15 months, third 22 months, fourth 22 months, fifth 24 months, and the sixth took 24 months to submit the final report to the government. Most often, the reasons for delay are not mentioned. It is also important to note that public discourse has been largely silent on the SFCs’ functions, operations, effectiveness, quality, and implementation. With all this in the backdrop, here are five critical challenges before Tamil Nadu’s seventh SFC Decentralisation of real administrative and financial autonomy from the state capital to district administrations, city corporations, and town and village panchayats is still a distant reality. Though the administrative coverage of urban local bodies has expanded to 25 cities from 16, the availability and quality of basic civic infrastructure and services remain inadequate and substandard. 1.Decentralisation of real administrative and financial autonomy from the state capital to district administrations, city corporations, and town and village panchayats is still a distant reality. 2.Though the administrative coverage of urban local bodies has expanded to 25 cities from 16, the availability and quality of basic civic infrastructure and services remain inadequate and substandard. 3. Increased regional disparities within districts have become a major challenge. The average per capita incomes in the western and northern parts of the state are significantly higher than those in the eastern and southern parts. 4.Another major hurdle is the lack of coordination among key departments, insufficient public consultation, and ineffective programme design in crucial sectors such as sanitation, water supply, electricity, roads, transport, policing, waste management, and wastewater disposal. These gaps create avoidable hardships, especially for the young. 5. Although there is significant scope to enhance revenue streams for local bodies in urban or rural administrations, state-level centralisation continues to constrain their autonomy in decision-making and their ability to address local issues and challenges. While neighbouring states Karnataka and Kerala have made significant progress in addressing challenges related to devolution of administrative power, these aspects have often been given piecemeal attention by Tamil Nadu’s SFCs and no commission has taken a holistic view of the structural challenges faced by the local bodies. The prayer is that this time

Tamil Nadu’s bumpy road to $1-trillion economy Read More »

Missing Markets for Managing Stubble Burning in Punjab and Haryana

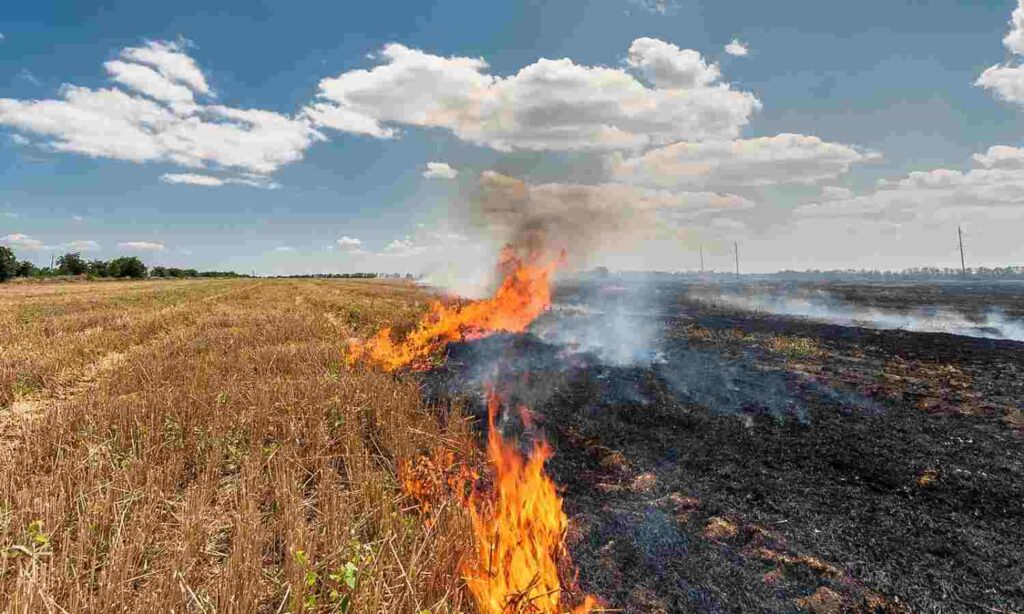
Missing Markets for Managing Stubble Burning in Punjab and Haryana Missing Markets for Managing Stubble Burning in Punjab and Haryana Naimitya Sharma June 5, 2025 Indian Economy, Public Policy, State Economies India’s quest for food security led to the development and consolidation of the rice and wheat cropping cycle in states like Punjab and Haryana. The Union government intervened in the agriculture sector to incentivise farmers with the help of Minimum Support Price (MSP) to ensure the adoption of the rice and wheat cropping cycle. Technological advancements in the form of a better variety of seeds ensured India, was able to feed its burgeoning population. Any intervention by the Government comes with associated costs over and above the direct fiscal costs. The specialisation in rice and wheat cropping pattern has led to huge environmental impacts.   In Punjab, there is an acceleration of groundwater depletion due to its greater utilisation for irrigating rice crops sown in the summer months. The government intervened again with a law forcing farmers to delay the sowing of rice. As a result, the gap between rice and wheat crop was reduced significantly. With a short window available and with increased use of combine harvesters for harvesting rice, the amount of stubble or crop residue increased and the time available to manage it reduced. The past few years have witnessed a consistent presence of air pollution in the Punjab and Haryana regions because of this stubble burning. To think about this important problem, we may utilise economic ideas of negative and positive externality. Air pollution created by stubble burning is an example of a negative externality. Economic theory predicts that there will be overproduction of activities leading to negative externality since all the costs involved are not accruing to the producers. Instead, some costs are being borne by society in the form of air pollution. As economic costs do not incorporate all social costs, stubble burning continues unabated. Conversely, Stubble management is an example of a positive externality. Economic theory predicts that there will be underproduction of activities generating positive externalities. The benefits of stopping a farm fire accrue to not just the farmer concerned but also to everyone around the farm. There are external positive benefits enjoyed by society, but these are not part of the demand for the management of stubble, therefore the overall demand is less and in effect, the production of the management of stubble is less than the ideal amount. The challenge for policymakers thus, is to balance the generation of negative externality, i.e., air pollution emerging from stubble burning, and the production of positive externality, i.e., management of crop residue to ensure governance of this market failure. To reduce the production of stubble, the Government is attempting various initiatives ranging from an outright ban on burning, to incentivise farmers to produce other crops or adopt shorter-duration seeds. To promote the management of crop residue, the government is providing subsidies on equipment to manage crop residue along with promoting productive usage of crop residue by creating supply chains and demand for upcycled products. At the end of the day, we can look at the problem of overproduction of stubble and underproduction of the management of stubble as a problem of missing markets. Intervention by the Government needs to focus on finding and nurturing these missing markets through carefully designed policies. How to find the missing markets? To find these missing markets, the first step is to identify key players and processes. These include innovators, scientists, environmentalists, entrepreneurs, concerned citizens, farmers, and communities trying to find productive uses for stubble. To understand how key players are productively using stubble we need to identify, collate, and replicate successful case studies of converting stubble into productive usage. This exercise can lead to capacity building, thereby generating and nurturing the missing markets. To demonstrate this strategy, we may observe one example of productive usage of stubble. Two young people, Arpit Dhupar and Anand Bodha of Dharaksha Eco-solutions have found an interesting use for stubble. They are using bio-fabrication to convert stubble into packaging material with the help of mushrooms. Observing this process of finding productive use of stubble reveals that there are layers of phenomenon, interplaying with each other to generate this productive usage. The social phenomenon of Arpit observing his nephew painting the sky grey, Arpit’s own lived experience of surviving in Delhi, along with traveling across North India and interacting with the farming community plays an important role in this success. The second ingredient of this process is the observation of the ecological or physical phenomenon by Arpit and his team where they identify the bio-fabrication carried out by root-like structures of Mushrooms on Stubble thereby converting stubble into a sturdier product. The interplay between these two phenomena, social need and ecological possibility generates a potentially sustainable solution for the management of stubble. When the founders of Dharaksha Eco-solutions reach a famous startup pitch competition, the repeated questioning by one of the investors leads to a further interplay, this time between economic reality and ecological possibilities. After facing questions about the monetary potential of his idea, Arpit responds by suggesting that it is possible not just to make packaging material but also alternatives of timber with the help of this bio-fabrication. This interplay led to the establishment of a more financially sustainable future pathway for Dharaksha Eco-solutions. The learning from Arpit’s journey suggests that one critical ingredient of finding the missing markets is finding opportunities for upcycling stubble by identifying productive usage. Concerned individuals will become key players if they have had meaningful social exposure to these problems, along with an understanding of ecological processes that might generate solutions. Additionally, scaling and financial sustainability require interplay with economic reality and ideas. We can focus on these observations to generate more key players and processes in the system by empowering individuals with travel and research grants to develop a deep understanding of such problems. Exposing concerned individuals to ecological and environmental education to

Missing Markets for Managing Stubble Burning in Punjab and Haryana Read More »

Tamil Nadu Budget 2025-26 Aims High But Fall Shorts

Tamil Nadu Budget 2025-26 Aims High But Fall Shorts Tamil Nadu Budget 2025-26 Aims High But Fall Shorts Chandrasekaran Balakrishnan April 8, 2025 Public Policy, State Economies, Tamilnadu Economy Few State Government Budgets are closely watched at the national and regional level for their key announcements and pragmatic policies on emerging sectors. Tamil Nadu state budget is one such. During the last four years, two finance ministers have presented the state budgets. This year’s state budget is the last full budget as the state assembly elections are due by early next year. We need to appreciate the state government for bringing out the first Economic Survey Report of 2024-25. Tamil Nadu is one of the major industrialised states in the country and has set a target of becoming a one trillion-dollar economy. By not addressing issues related to faster urbanisation, slow paced structural and institutional reforms, lack of decentralisation of governance, rationalisation of overall state’s debts and debts of energy department, the State Budget for 2025-26 may be termed as a missed opportunity. Further, there are several low-hanging fruits to which the state budget did not pay enough attention. Moreover, the state’s window of demographic dividend is already over and faces a shortage of workforce across sectors, which is a major cause of concern. Therefore, the aims to achieve a one trillion-dollar economy dream by 2030 may not be feasible. Indian economy is on the verge of pushing its growth trajectory upwards given the global challenges. Tamil Nadu economy has a major role to play at national level contributions, hence the state budgets should aim and leverage for strengthening the institutional delivery system and decentralised approach of governance. The Budget for the current financial year focuses on social welfare measures which were highlighted most predominately for building popular narratives on distributive political economy. Nevertheless, few pragmatic policies were announced in the Tamil Nadu budget 2025-26 which includes new policies in frontier sectors like Tamil Nadu Semiconductor Mission-2030, Tamil Nadu Maritime Transport Manufacturing Policy 2025, A policy on Animation, Visual Effects, Gaming, Comics and Extended Reality (AVGC-XR), and Integrated Renewable Energy Policy. These are welcome steps. On healthcare, there are measures proposed to prevent and completely eradicate cervical cancer in Tamil Nadu. The Government has planned to provide HPV vaccination to all girls aged 14 years progressively. Further, the state has also proposed to set up “Chennai Science Centre” with the allocation of Rs.100 crore and 2 Basic Sciences and Mathematics Research Centres in Chennai and Coimbatore, in collaboration with renowned research institutes like the Indian Institute of Science (IISc) and Tata Institute of Fundamental Research (TIFR) respectively. Further, the State Budget for 2025-26 also announced a few welcome measures like raising of Municipal Bonds to the extent of Rs.200 crore for the Greater Chennai Corporation, Rs.120 crore for the Coimbatore Corporation, Rs.100 crore for the Trichy Corporation, and Rs.100 crore for the Tiruppur Corporation for increased capital expenditures to bridge gaps in civic facilities. However, the state has been facing multiple challenges on fiscal health indicators, which is a serious concern. As a result, the state faces a number of sectoral challenges, as highlighted by the Economic Survey. Rapid urbanization drives demand for infrastructure services such as transportation, housing, sanitation, and utilities- energy sector, use of technology in service deliveries, etc. However, the budget has given little attention to contemporary issues of lack of public infrastructure for industrial development and urban mobility aspects. Tamil Nadu is the second most urbanized state (54.13% in 2024) after Kerala. The state budget allocated funds for the urban sector are only Rs.34,396 crore under the Municipal Administration and Water Supply Department (Rs.26,678 crore) and Housing and Urban Development Department (Rs.7,718 crore). While, in 2023-24, 54.63% of Tamil Nadu’s urban workforce was employed in the service sector, close to the national average of 58.07%. The state government trained about 41.38 lakh students in the last 4 years, but only 2% of them are employable as per their assessment. Tamil Nadu is ranked 2nd nationally in 2023-24 with 35.56 lakh Udyam-registered Micro, Small, and Medium Enterprises (MSMEs). Of these 10.69 lakh (30%) were in manufacturing MSMEs, while 24.87 lakh (70%) were services-oriented MSMEs. These MSMEs provide employment to 2.56 crore workers in the state. While the budget allocations for industrial development are very meager. A total of Rs.3,915 crore allocated to the Industries, Investment Promotion, and Commerce Department, and a total of Rs.1,918 crore has been allocated to the Micro, Small, and Medium Enterprises Department. Thus, a total of Rs.5833 crore for industrial development. Another important sector is mobility, which is a growth driver for the state. The state has a population of 8.3 crore, but the total number of public transport buses is only 20,260 in 2023-24. Daily passengers travelling in public transport was 1.76 crore in 2023-24 increasing from 1.31 crore in 2019-20. As per the state economic survey, the state government has planned to introduce 8,682 new buses and has placed orders for 8,182 buses with financial support from KfW, the World Bank, SADP, and the state. MTC, a public-sector organisation, will procure 625 more e-buses as a component of the World Bank. However, the State Budget announced that about 1,125 electric buses will be deployed for public use starting this year: 950 electric buses in Chennai, 75 electric buses in Coimbatore, and 100 electric buses in Madurai, A total of Rs.12,964 crore has been allocated to the Transport Department. Also, Rs.20,722 crore has been allocated for Highways and the Minor Ports Department. The number of startups in Tamil Nadu has increased fivefold over the past four years, surpassing the 10,000 marks. But their presence is restricted to a few districts like Chennai, Kanchipuram, Thiruvalluvar, and Coimbatore. The start-ups are not diverse in sectoral focus and also not as dispersed across the districts in the south, east, and central parts of the state. In terms of sectoral fund allocations, only Rs.131 crore has been earmarked for the Information Technology and Digital Services

Tamil Nadu Budget 2025-26 Aims High But Fall Shorts Read More »

Highlights of Tamil Nadu’s First Economic Survey – 2024-25

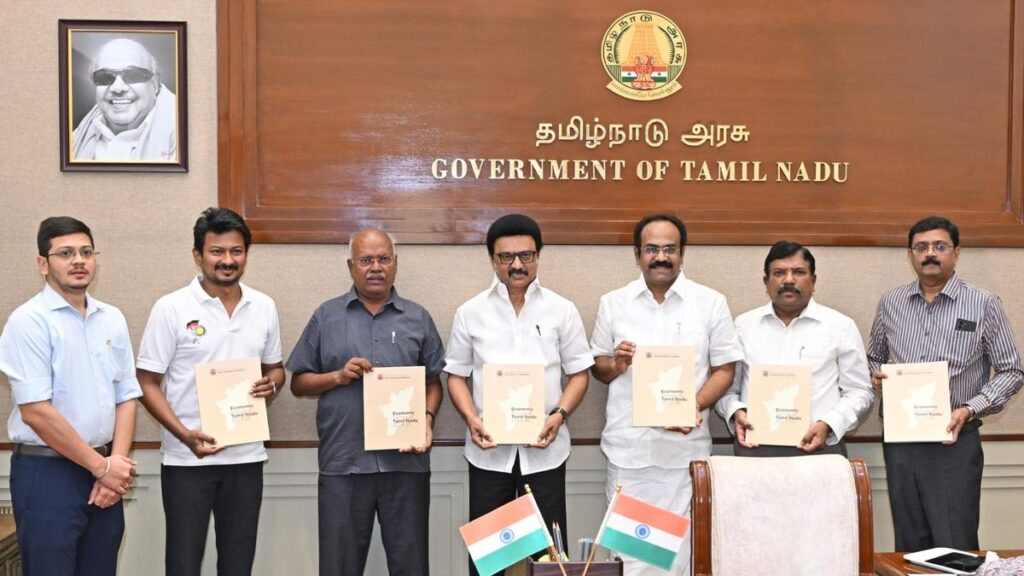
Highlights of Tamil Nadu’s First Economic Survey – 2024-25 Highlights of Tamil Nadu’s First Economic Survey – 2024-25 Chandrasekaran Balakrishnan April 1, 2025 Public Policy, State Economies, Tamilnadu Economy The economy consists of several components, including both institutional and individual people. Studying the progress of those components individually and collectively helps the governments, economy, and society to make future policies. The study of sectoral and sub-sectoral progress is an important exercise for the government to plan for its resource allocation and the economy to identify the growth potentials to be harnessed by the people and the private sector. After the Independence, the Union Government introduced the Annual Economic Survey Report along with Budget announcements in the year 1950-51. Given the importance of the economic survey analysis and perspectives on global and domestic policies on sectoral areas, the then Union Government separated the Union Budget and Economic Survey Report in 1964, which is being followed. Since the major economic reforms of 1991, the States embarked on building their growth and development path by bringing out a detailed analysis of sectoral, regional, intra-state district-wise, and block-wise progress of development. Like the Union Economic Survey, many State Governments have also started publishing their own economic survey to present a review of the major developments of the economy and make policy suggestions for the future.  For many years, all the Southern States have been publishing their annual economic surveys while presenting the budgets. The State of Tamil Nadu, the sole exception for years, has joined the bandwagon by publishing its “First State Economic Survey 2024-25” on 13th March, 2025, a day before the Budget Announcement for the financial year 2025-26 on 14th March, 2025. The survey was prepared by the Tamil Nadu State Planning Commission, led by a team of experts. The Government of Tamil Nadu used to bring out the “Economic Appraisal” report published by the Department of Evaluation and Applied Research (DEAR), with time lags. These reports were a kind of review of progress with little attention for public policy perspectives. This analysis focuses on key highlights of the Tamil Nadu’s First Economic Survey 2024-25 in terms of its presentation, and analysis of key issues. The state has set an ambitious goal of achieving a $1 trillion economy by 2030. As a highly industrialized and urbanized economy with strong linkages of global value chains on key sectors, Tamil Nadu’s economy has demonstrated remarkable economic resilience, consistently achieving growth rates of 8% or more since 2021-22. The state is estimated to grow above 8% in 2024-25. Further, the State achieved an average growth rate of 6.37% as compared to the national average of 6.1% during the period from 2012-13 to 2023-24. In the last two years from 2022-23 to 2023-24, this growth trajectory accelerated and the state achieved an average growth rate of 8.18%. The state did not estimate the likely growth rate for the financial year 2025-26 stating the economic situation is “unstable”. In terms of Per Capita Income at current prices, Tamil Nadu has Rs.2.78 lakhs which is 1.6 times more than the national average of Rs.1.69 lakhs in 2022-23 and is 4th largest state in per capita income ranks. While, in real terms, Tamil Nadu ranked 7th among major states in 2022-23, with a per capita income of Rs.1.66 lakh. However, there are huge variations among the districts within the state of Tamil Nadu. The district-wise per capita income highlights major variations among districts in Tamil Nadu. Chengalpattu district has the highest per capita income at Rs 6.48 lakh in 2022-23, followed by Kancheepuram (Rs.6.47 lakh) and Chennai (Rs 5.19 lakh). Notably, in 8 out of the state’s 38 districts, the per capita income exceeds the state average of Rs.2.78 lakh. These top-performing districts surpass the per capita income levels of several major Indian states, including Telangana, Haryana, and Karnataka. At the same time, the districts of Villupuram and Tiruvarur has per capita income of Rs.1.48 lakh each which is lowest in the state. Also, 7 districts (Ramanathapuram, Thiruvarur, Myiladuthurai, Ariyalur, Perambalur, Kallakurichi and Villupuram) have per capita incomes below the national average. Rapid urbanization drives demand for infrastructure services such as transportation, housing, sanitation, and utilities but in each of these areas, Tamil Nadu lags and is unable to provide good quality of facilities and services. Let’s look at the sectoral growth of Tamil Nadu’s Economy as emphasized in the Economic Survey: Tamil Nadu’s agriculture heavily depends on monsoons. The sector contributes Rs.1.5 lakh crore (6% of GSVA) and ranks as the 5th largest sector. It employs 41.1% of the rural workforce. In 2021-22, the state had 92.3 lakh farmers cultivating 64.6 lakh hectares of land. Notably, 93.5% of these farmers (86.3 lakh) are small and marginal, collectively farming 62.7% of the total cultivated area, with an average landholding size of only 0.7 hectares. Tamil Nadu’s 62% of the total cropped area includes major food grains, like paddy, maize, jowar, bajra, ragi, and millets, while non-food crops such as oilseeds, sugarcane, and cotton account for the remaining 38%. Paddy continues to dominate the cropping pattern, with its share in the total cropped area increasing from 32.1% in 2019-20 to 34.4% in 2023-24. The state’s consumption of fertilizers increased by 1.03 lakh MT to 10.68 lakh MT in 2023-24 from 9.65 lakh MT in 2019-20. Power consumption in agriculture also increased by 4146 million units to 17,957 million units and from 13,811 million units during the same period. The state government has allocated Rs.7,216 crore for the subsidy on three phases of free power in 2024-25 which needs to be rationalized by undertaking institutional reforms to eliminate power thefts and losses. The rise in the productivity of key crops in Tamil Nadu has been largely driven by the extensive use of chemical fertilizers and groundwater. The state has a total of 268 cold storage units with a combined capacity of 19,856 metric tonnes which is still inadequate given the expansions. The state’s organic farming has nearly doubled, rising from

Highlights of Tamil Nadu’s First Economic Survey – 2024-25 Read More »