A Critical Analysis of Tamil Nadu Economic Survey-2025-26
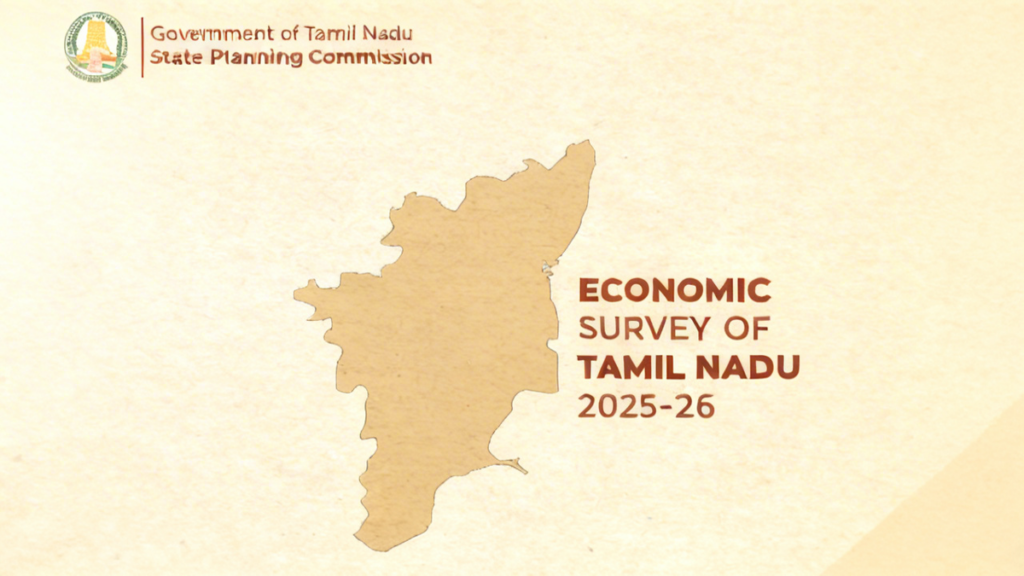
A Critical Analysis of Tamil Nadu Economic Survey-2025-26 A Critical Analysis of Tamil Nadu Economic Survey-2025-26 Chandrasekaran Balakrishnan February 19, 2026 Public Finance, Public Policy, Tamilnadu Economy Among the major states in India, Tamil Nadu becomes a last one to release the annual Economic Survey beginning last year, 2024-25. The second edition of Tamil Nadu Economic Survey 2025-26 were prepared by the State Planning Commission, supported by research institutions, the support of subject experts and the finance department of the state government. The Survey provides the nuanced global perspective of the Tamil Nadu economy and its sector wise progress linking with the Indian economy. The Survey highlights the major strengths of social development, rapid industrialisation and economic prowess. However, the quality of social development and physical infrastructure services is not objectively assessed with robust data. Moreover, inter district and intra district regional challenges are still not given adequate attention by policymakers in the state. Nevertheless, the report also rightly identifies the underpinning key systemic challenges faced by the Tamil Nadu economy, including intra-district disparities. Tamil Nadu aims to achieve a one trillion-dollar economy by the year 2030. This year’s economic survey signals that the ambitious vision may be delayed by a year or two. The Survey notes that “If Tamil Nadu sustains its 2024 25 nominal growth rate of 16% and with an assumption of 2% (medium-term rate) rise in the value of dollar against rupee per annum in the medium term, it can achieve the trillion-dollar milestone by 2031. With 3.5% (short term rate of rise of dollar value), it may be delayed for a year.” In terms of nominal prices, Tamil Nadu’s GSDP is estimated at US $370 billion (Rs. 31.19 lakh crore) for 2024-25, reflecting a strong 15.98% annual growth. Whether the state economy is able to sustain this double-digit and high growth rate for the next few years is a big question because the fiscal challenges are mounting quite alarmingly in recent years. In this regard, the state economic survey also notes that “future pressures arising from pay revisions, pensions, and GST rationalisation could strain fiscal space. Sustaining growth will therefore require disciplined and productive use of resources.” The state has one of the lowest rates of multidimensional poverty (1.43% in 2022 23) and is also the second most urbanised state with 54.72% people living in urban areas in 2025 after Kerala’s 80.08%. However, the “urban infrastructure deficits compound housing stress, with pressure on water supply, sewerage, stormwater drainage, solid waste management, transport, and public spaces, and uneven service levels across urban local bodies (ULBs)”. Further, the survey notes that “climate change has further intensified such vulnerabilities disproportionately affecting low-income households. Institutional constraints—limited fiscal autonomy, capacity gaps, fragmented planning, and rising operation and maintenance liabilities—add to these challenges.” The state economic survey has highlighted the following as key challenges faced by the Tamil Nadu Economy, to which the future government warrants more close attention: The “execution challenges related to coordination, land acquisition, regulatory clearances, and capacity building remain binding constraints” in areas like “transport, logistics, energy, water, and urban and rural services. Investments in public transport, electric mobility, metro expansion, and digital integration demonstrate a people-centric mobility vision, while ports, airports, and logistics parks”. There are structural flaws in the area of urban development in Tamil Nadu. Recently, the state government has announced expansions of rural and urban local bodies without adequate attention on how to mobilise resources for building infrastructure facilities for making ease of living for all sections of society. Keeping this in view, the state economic survey rightly notes that “Going forward, the strategy must shift from a project-centric approach to a systems oriented urban transformation framework. Priorities include expanding affordable and rental housing, improving land and housing market efficiency, embedding climate resilience into planning and building norms, strengthening ULB fiscal sustainability, and enhancing metropolitan governance.” “Tamil Nadu is India’s fastest-growing EV manufacturing hub. Global players such as Ola Electric, Ather Energy, BYD, TVS, Vinfast, Ampere, and several battery companies have set up factories in the state.” However, in terms of the total number of EV buses deployed in Tamil Nadu for public transportations is 380 only, which is small as compared to states like Karnataka (1500) and Maharashtra (4000). It is interesting to note that the Survey emphasises “Environmental governance in Tamil Nadu is institutionally advanced but faces increasing strain from industrialisation, urbanisation, and climate risks. Persistent challenges related to water pollution, waste management, and air quality call for technological upgrading, stricter enforcement, and greater community-based transparency. Institutional fragmentation and data silos weaken policy coherence, indicating the need for deeper coordination and integrated data systems.”In each of these areas, the key issue is the efficacy of policies, rules and regulations at the taluk level, district level and regional level, which were very weak across different departments of the state government. As highlighted by the Survey, finding “quality employment for its youth” is a major challenge for the advanced states like Tamil Nadu and also at the national level in India, in reaping the demographic dividend. A larger number of youth are completing higher education without the employable skills and competences as demanded by markets and industry. The survey also notes that “a persistent shortage of affordable housing for Low Income Groups (LIG), informal workers, and migrants remains a major challenge. Escalating land prices, limited availability of serviced land, financing constraints, and regulatory rigidities have widened the demand supply gap, resulting in the continued prevalence of slums and informal settlements.” Though, Tamil Nadu has slightly more Research and Development (R&D) labs of 906 in the industrial units providing training as compared to Maharashtra (858) and Gujarat (821) but in terms of total R&D spending by industries are more in Maharashtra (Rs. 2,243 crore) and Gujarat (Rs.1,814 crore) as compared to Tamil Nadu (Rs 1,143 crore). Tamil Nadu has more public sector factories (163) providing large-scale employment (38,876) as compared to Maharashtra (98 factories, 26,224 employees) and Gujarat (139 factories, 20320 employees), but
A Critical Analysis of Tamil Nadu Economic Survey-2025-26 Read More »